Can't Stand the Heat?
By Brandon Wong | April 25, 2020
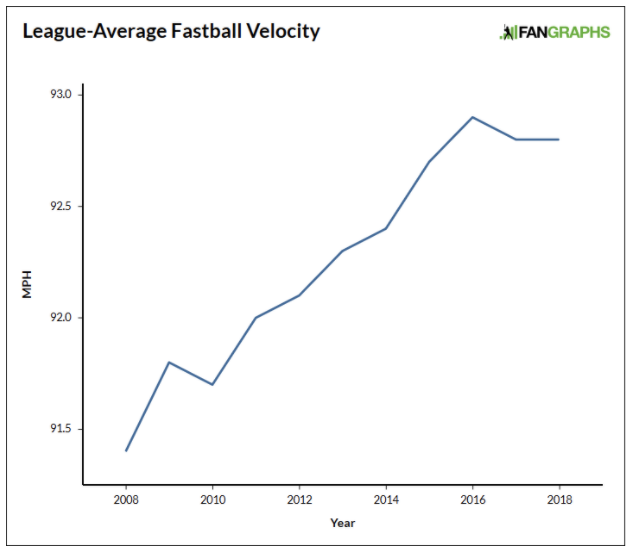
No matter how silly a batter looks when they swing and miss at a nasty 12-6 curveball or fall to one knee after flailing at a pitch in the dirt, nothing will beat the satisfaction of blowing a fastball right by him and hearing the umpire scream “Striiike Threeeee!”. This is simply a fact of baseball and no matter how creative pitchers get, the fastball is here to stay. The fastball is not stagnant, however, as over the past few years, pitchers like Jordan Hicks, Aroldis Chapman, Noah Syndergaard, and Gerrit Cole have continued to push the boundaries, consistently putting up triple digits on the gun. It is no secret that the average fastball velocity has been increasing over the past few seasons and the metric below proves it.
At the same time, many of these pitchers have been shattering records as just this past season, Gerrit Cole averaged the most strikeouts per 9 innings in the history of the MLB. In fact, 18 out of the top 100 single season records for strikeouts per 9 innings were set in 2019 alone. And, in the last five seasons, 50 out of the top 100 single season records for strikeouts per 9 innings were set. That number is staggering as the MLB has been around for 151 years yet, in the span of just five years, half of the records have been set! This would then explain the drastic 14.3% increase in total strikeouts per season from 2015 to 2019. These numbers, therefore, beg the question, is the increase in fastball velocity the cause of the rise in the number of strikeouts? To preface this study, I will be separating relief pitchers from starting pitchers as their roles are significantly different.
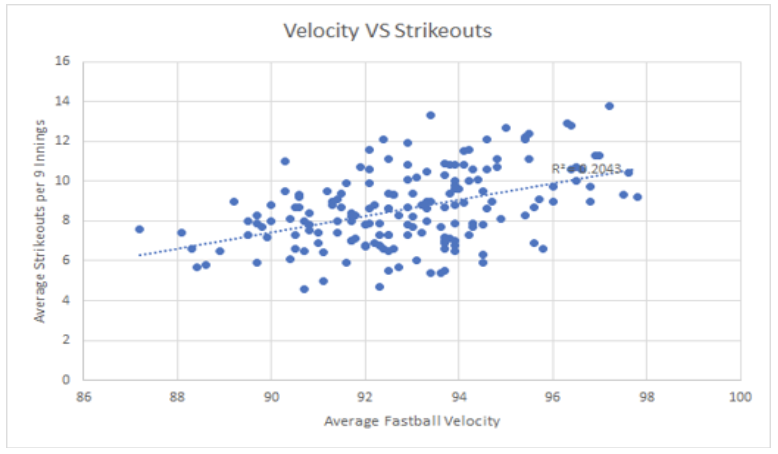
This first plot is representative of starting pitchers who have started at least 10 games during the 2019 season. As you would expect, Gerrit Cole’s dot is located in the upper right hand corner of the graph and is the highest point indicating that he had the most strikeouts per 9 innings this season. The scatter plot has an R squared value of 0.2043 which does not imply a strong linear correlation, but clearly depicts that higher fastball velocities tend to lead to more strikeouts.
There are, however, a couple interesting players to look at. The first of which is Chris Sale who throws, on average, a 93.4 mph fastball, which is just about the league average, but ranks second in strikeouts per 9 innings in the 2019 season with 13.3 which would have put him at third all time if he had qualified for the ranking. That is an incredibly high mark yet, unlike Cole, he does not throw a fastball at high velocity. So, does that mean his fastball is ineffective and that he must only use his legendary slider to strike batters out?
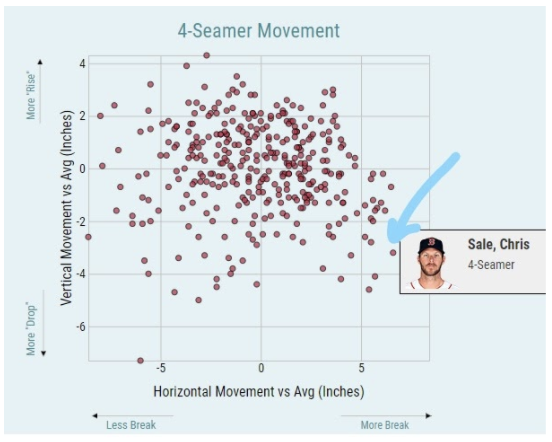
While it is no secret that Chris Sale’s slider can be nearly unhittable, his 4-seam fastball is no joke. It may be surprising to find out that he uses his fastball 36% of the time which is almost as often as his slider which he uses only 38% of the time. Although he does not possess the velocity of a Cole or deGrom, what he does have is an insane amount of horizontal movement with his fastball. The plot above shows the average fastball movement of every pitcher in the MLB in both the vertical and the horizontal direction with respect to the league average. Sale’s 4-seamer is far to the right indicating that his fastball moves 6.6 inches more, horizontally, than the average MLB pitcher’s and that his fastball ranks highly when it comes to break.
This, therefore, means that pitch movement must play a large role in striking a batter out as Sale’s velocity is nothing special, yet he strikes out more batters than nearly every other pitcher. We must then take another look at Gerrit Cole to determine whether or not he simply throws gas to strike batters out.
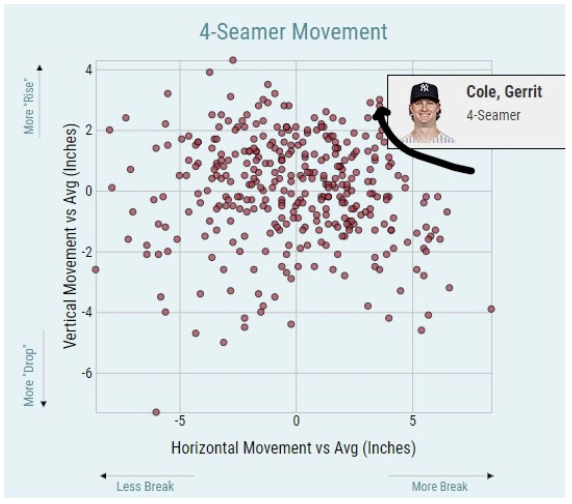
Looking at the same plot, Gerrit Cole’s 4-seam fastball also has significantly more horizontal break(3.6 inches) than the average pitcher and also has more vertical rise(2.8 inches) as well. Although this is not nearly as much as Sale, it shows that he does not rely solely on heat to make his fastball effective. This is what separates Cole from the rest of the league and makes him a truly elite pitcher.
We can contrast this with Diego Castillo who is no scrub, but has not had the same amount of success as Cole despite throwing at a higher average velocity. The graphic below looks slightly different than that of Cole and Sale, but that is only because Castillo uses a 2-seam fastball, or sinker, rather than a 4-seamer.
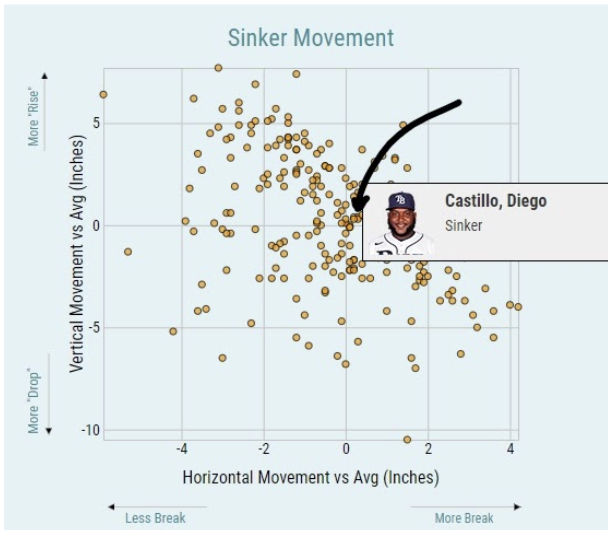
As we can see, Castillo lies right on the intersection between the 0’s on the axis which means his movement is just about on par with the league average. This is not a knock on him in any way, but it means that when it comes to the movement of his 2-seam fastball, it is no better than the average pitcher. When we take this into account and take a second look at the initial graph that I presented which plotted strikeouts per 9 against a pitcher’s fastball velocity, we will see that Castillo’s dot is located farthest to the right indicating that he has the highest average fastball velocity yet, he only strikes out 10.6 batters per 9 innings. This is not a low amount by any standard and we have seen that there is some correlation between a pitcher’s fastball velocity and the rate at which they strike batters out, but this is significantly lower than the 13.3 strikeouts that Cole is averaging per 9 innings. That difference is likely due to the difference in movement between their heaters.
So, instead of throwing your arm out for a couple extra strikeouts, remember that velocity isn’t everything and that a dominant fastball can’t be one-dimensional.
As the graph implied there is no concrete correlation between the increase in fastball velocity and the increase in the number of strikeouts, but it is likely that it played a role in the spike. What can be determined, however, is the importance of fastball movement when it comes to getting that coveted punch out that every pitcher craves.