Predicting the 2018 Draft's 4th Year WAR
By Michael Athanassiadis | March 28, 2022
Now in their fourth year, some of today’s burgeoning NBA stars drafted in 2018 have been handed their first huge contracts. As of October 21, 2021, 11 players from the draft have signed rookie extension contracts. However, the rest are set to negotiate deals once the 2021-22 season ends. Among the names signed are Luka Doncic, Trae Young, and Shai Gilgeous-Alexander, each of whom are now locked into max extensions worth up to $207 million over the next five years.
Atlanta Hawks All-Star G Trae Young has agreed to a five-year, $207 million designated rookie maximum extension, his agent Omar Wilkes of @KlutchSports tells ESPN.
— Adrian Wojnarowski (@wojespn) August 3, 2021
Dallas Mavericks superstar Luka Doncic has agreed to sign a landmark five-year, $207 million supermax rookie extension, his agent Bill Duffy of @BDA_Sports tells ESPN. https://t.co/vVj770OD8A
— Adrian Wojnarowski (@wojespn) August 9, 2021
There were also some surprise extension snubs from the 2018 Draft. Deandre Ayton, the first overall pick and a standout center for the Phoenix Suns, will have to wait until the summer to decide whether to stay with the team or play in a different city. In the meantime, the Suns have already extended two 2018 draftees–Landry Shamet, who is a reliable bench player, and Mikal Bridges, a great 3-and-D guy, each for four more years. Miles Bridges, who has made huge strides offensively this season, also did not get a deal done by the deadline and could be on the move from the Charlotte Hornets.
With these roster decisions in mind, it would be helpful to better understand or even predict player value. This would help us see whether Miles Bridges and Deandre Ayton, for example, were truly snubbed, or if there is evidence that they are not adding to the team as much as the eye-test alone shows. FiveThirtyEight has created a few different metrics that help quantify player value. They each rely on the newest player-tracking and play-by-play data, which is far-removed from the fans’ experience of games since they do not end up in the traditional box score.
The two newest FiveThirtyEight metrics created to quantify value are RAPTOR (Robust Algorithm using Player Tracking and On/Off Ratings) and WAR (wins above replacement). RAPTOR measures the amount of points added by a player on offense and defense per 100 possessions. The chosen RAPTOR for a replacement level player sits at -2.75 per 100 possessions and is the average for fringe NBA players fighting for a guaranteed contract. WAR uses RAPTOR in addition to pace statistics to calculate the level of wins above -2.75 for a given NBA player. (Source: https://fivethirtyeight.com/features/how-our-raptor-metric-works/ )
Even though they are not directly factored into FiveThirtyEight’s calculations, I wanted to see whether traditional box score stats like points scored, field goals attempted, and effective field goal percentage could predict player value. Additionally, I tried adding in more values like minutes played and pick number in hopes of making an even more accurate model. This is all in an effort to understand contract extensions using data more readily available to the everyday fan. While more advanced player-tracking values require a good amount of digging, the traditional box score and stats table is one of the first places NBA-watchers go to inspect how good a player has been performing.
The Data
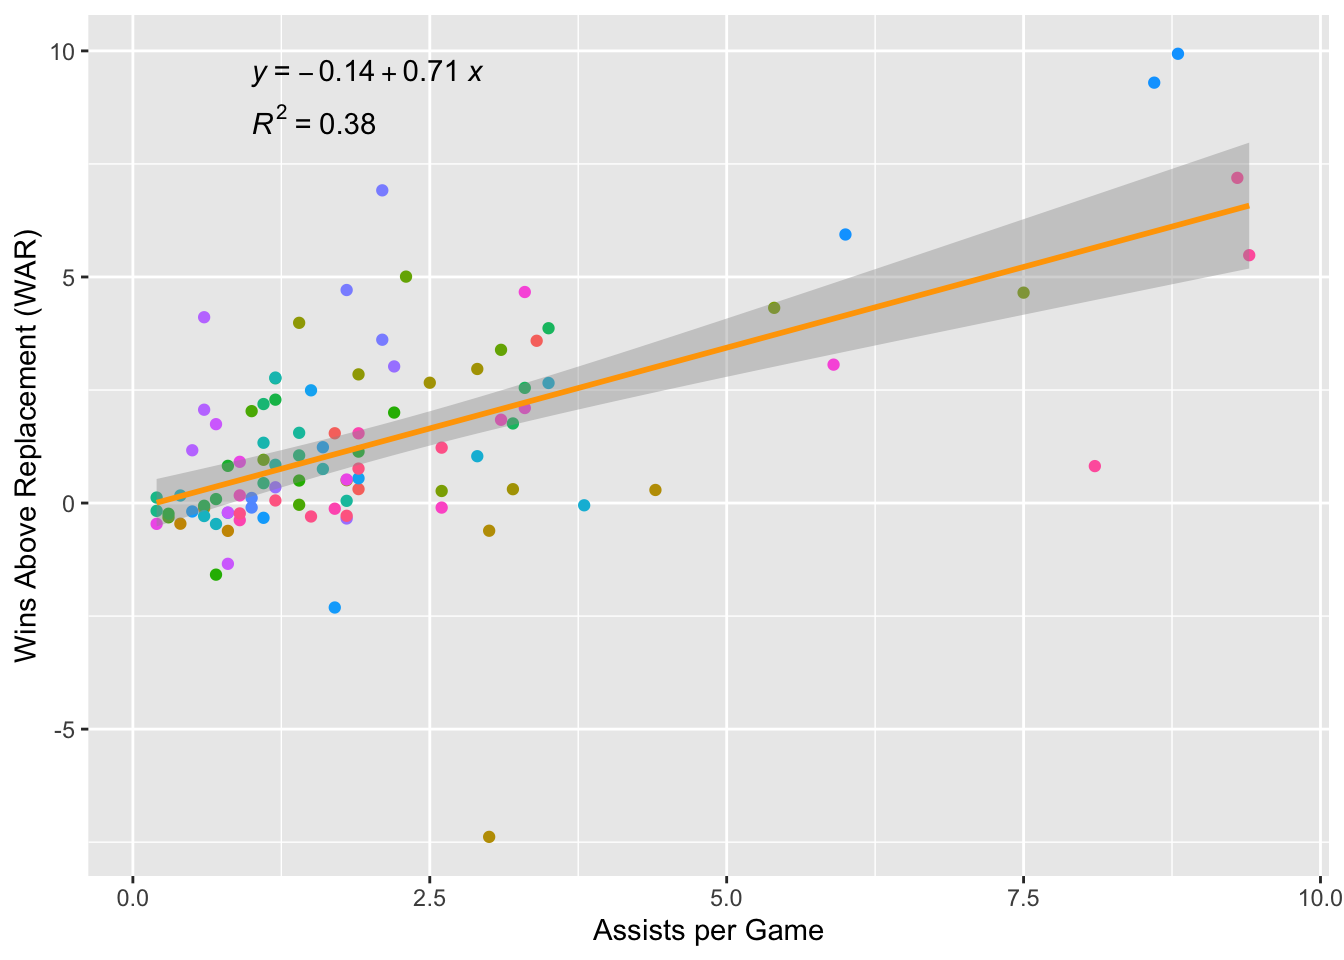
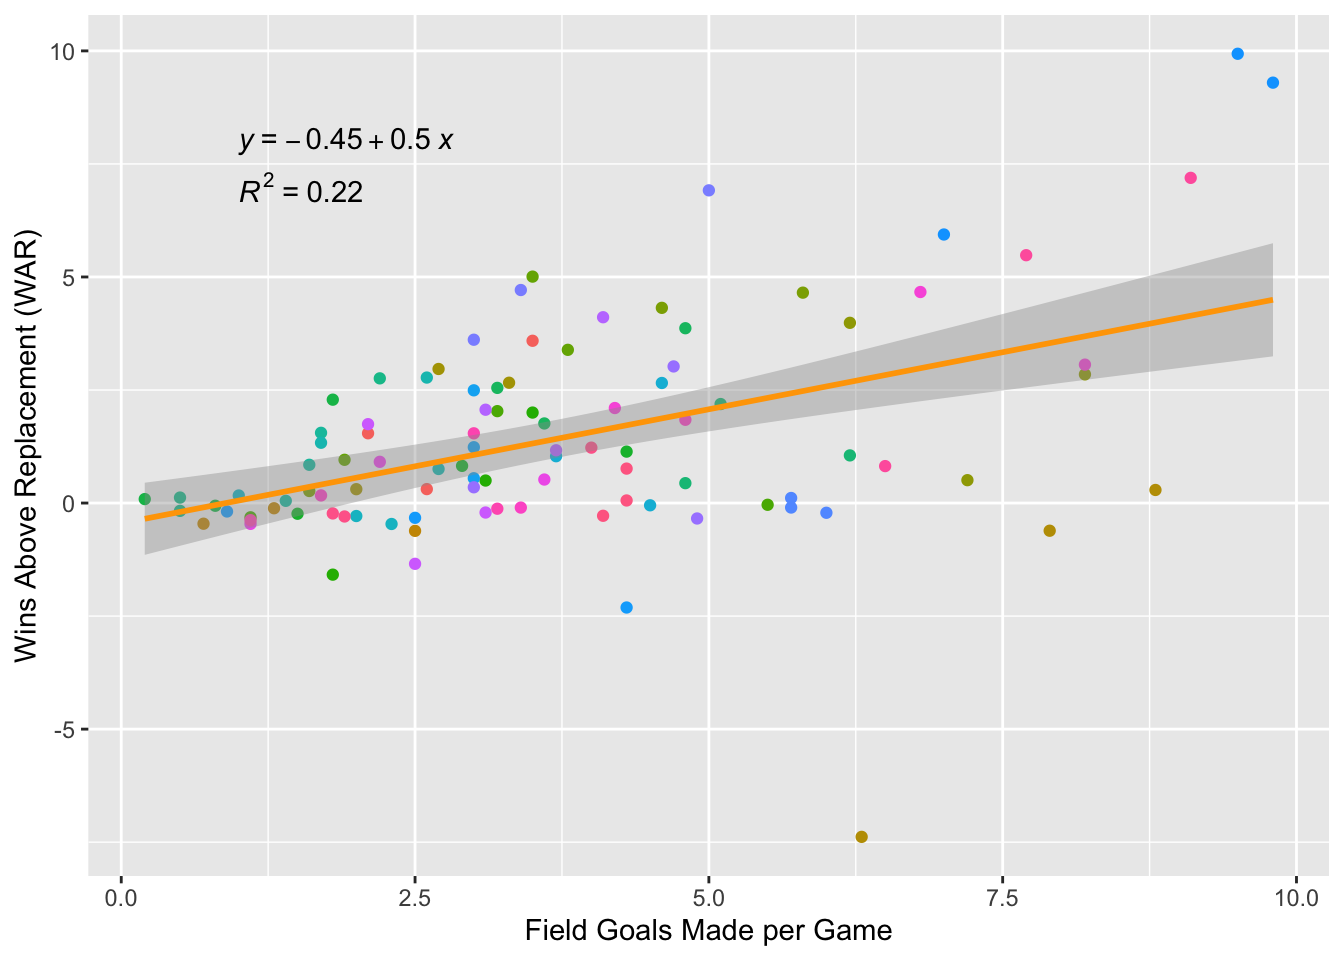
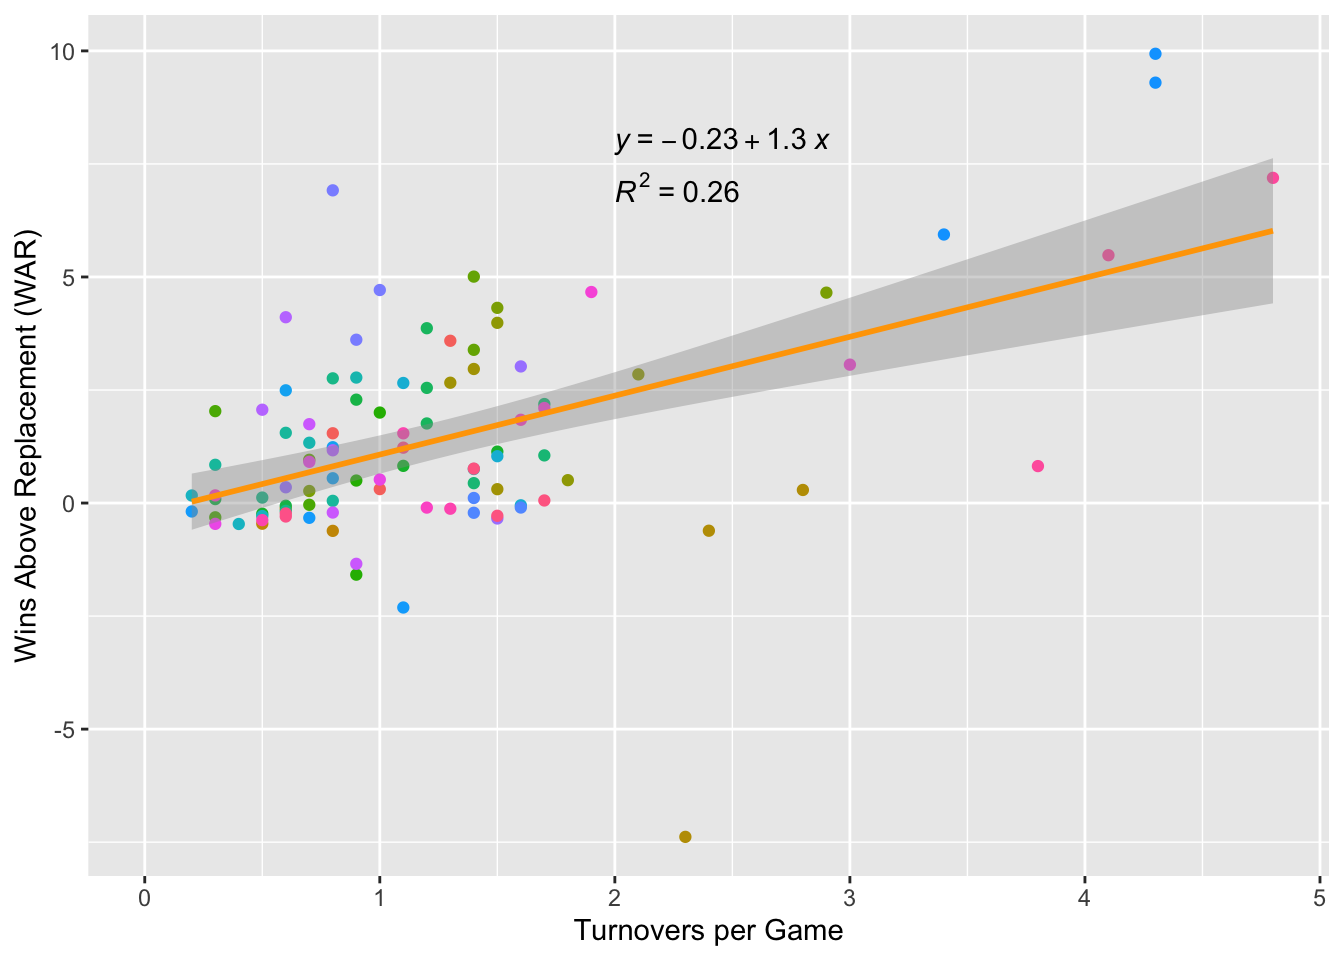
From the set of traditional box score statistics chosen to be included in the linear model, below are a few that have a stronger relationship with WAR. In these scatterplots, 2018 draftees are graphed once for each of their first three seasons in the league and are color coded by player. The linear regression shown in orange for each graph and its respective equation displayed in the visualization are to be fed into the model.
One of the following metrics–assists, field goals made, and turnovers per game–is graphed against the player’s respective WAR for that particular season. These stats all yielded pretty high R2values, which are calculated on a scale from zero to one and give you a sense of how well a regression fits the data. I know, they don’t seem ‘pretty high’! But given that we are talking about basketball and not some controlled experiment, they are. One extra note beyond the graphs is that these stats are all heavily reliant on usage. For example, Luka Doncic–the blue outlier in every scatterplot–is the focal point of his offense. As a facilitator and top scorer, he puts up extremely high field goal and assist numbers compared to the rest of the draft class. It makes sense then, that turnovers, a byproduct of having the ball in your hands often, correlates positively with WAR even though it is a negative stat.
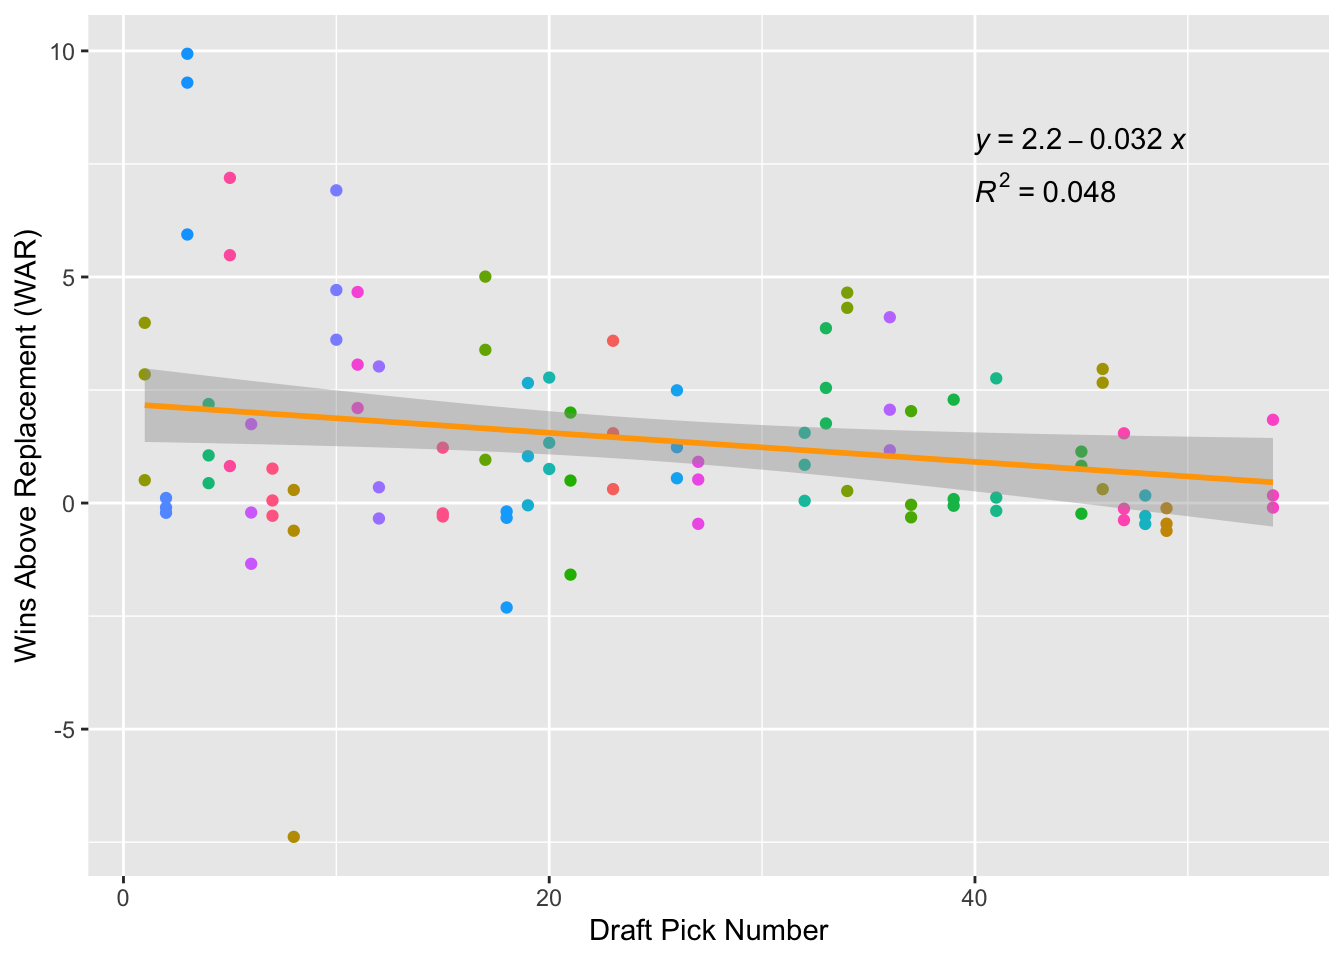
Some other traditional stats surprisingly had weaker relationships with WAR. In the scatterplot shown below, each 2018 draftee is graphed according to their WAR for each of their first three seasons and their respective pick number. The graph shows a very low linear correlation between the draft position and WAR for players picked in 2018. This result might be because of how many second round gems were taken in this draft. However, the range of WAR values definitely tightens around to zero later in the draft, giving us a sense of a more general trend. Though the linear regression produced has a very low R2 of 0.048, showing that draft pick alone does not relate strongly to player value in terms of WAR, when added as a variable along with various other factors, the model’s overall correlation actually improves.
The Results
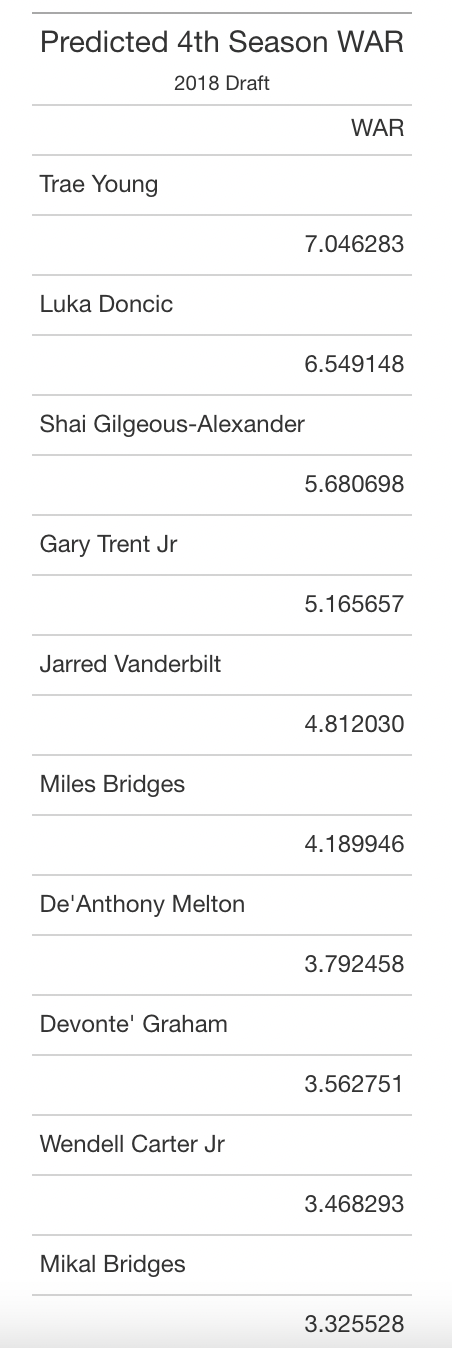
Once those and a few other regressions were inputted, the model was finally born. On the left is a table showing the top ten 2018 draftees by their predicted fourth year WAR using the season’s statistics. We can actually get a pretty good idea of how the 2018 draftees contributed offensively and defensively using traditional statistics. Whereas FiveThirtyEight has Luka Doncic and Trae Young at one and two, their positions are switched in the prediction. Additionally, the model underestimated both players’ WARs. As of March 20th, Luka and Trae have 8.5 and 8.0, respectively.
Interestingly, the model predicted Mikal Bridges’ WAR to be 3.245, or just out of the top 10 in the 2018 Draft class.However, out of all players in the first four years, FiveThirtyEight has him 3rd with a WAR of 6.8. This discrepancy could have been caused by the impact Mikal has with his defensive positioning which has led to big leads for the Suns, an element which traditional box scores overlook.
If we look back at the initial question–why have some players like Luka and Trae been handed huge deals while others like Miles Bridges or Deandre Ayton have not–we now have a much better understanding. Ayton, even with upper echelon traditional statistics, was left out of the top 10 at 16th. On the other hand, Miles, who has so far had a breakout season, is looked highly upon by the model, possibly fortelling a great offseason for the young power forward. Though imperfect, this nifty regression model bridges the gap in information between the everyday fan and NBA-enlisted data scientists. With trends found using easy-to-understand statistics straight from the NBA app, wins above replacement, a complicated metric, has hopefully become more digestible.