How Meaningful is the NBA ROTY Award?
By Surya Vedula | April 16, 2023

Since the 1960s, awards have helped shape NBA history and the way fans perceive players of different generations. In most cases, an accolade in this league is a stamp that etches a player in the history books as one of the greatest to ever do it. For instance, Kareem Abdul-Jabbar won the NBA MVP 6 times while Michael Jordan and Bill Russell won it 5 times each. Meanwhile, LeBron James has 13 All-NBA First Team Selections while Kobe Bryant and Karl Malone won the award 11 times each.
However, one accolade that has been a source of intrigue for decades is the Rookie of the Year (ROTY). A huge reason for this is the fact that a wide range of different-caliber players have walked away with it in the past. There are Hall of Famers who’ve won it, like Michael Jordan and LeBron James. Then there are role players like Emeka Okafor and Michael Carter-Williams who’ve walked away with the award. This brings us to the question: how telling is the ROTY award regarding how good a player will be compared to his peers?
Career Minutes Per Game and Total Games Played
A lot of times, it’s possible to tell the caliber of a player or how important he is to his team based on his minutes per game (MPG), with stars generally averaging high end MPG (i.e. 30+ minutes per game) while most role players are on the mid to lower end of the curve. On the other hand, while total career games played isn’t necessarily the most accurate depiction of a player’s caliber, it’s a better indicator of the longevity of his career and his durability over the course of an NBA season.
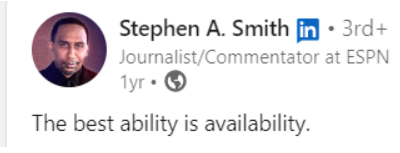
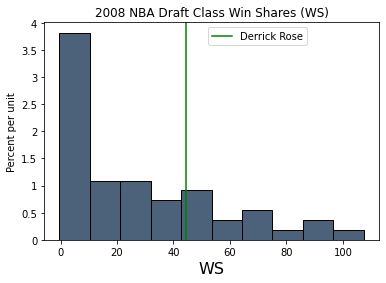
In the words of Stephen A. Smith, a renowned Sports Journalist and Commentator at ESPN, “The best ability is availability”. In many ways, this sentiment is shared by several organizations around the league. As a result, when evaluating a player against his peers, it’s important to take into account both the player’s caliber and his availability. For instance, players like Greg Oden, Anthony Davis, and Derrick Rose, while dominant, have been hampered over their respective careers due to their lack of availability as a result of injuries. Thus, contextualizing evaluations of a player using both MPG and career games played helps gain insight into what level he played at and how long he was able to sustain that.
For our analysis, we’ll look at the draft classes of 2002, 2004, 2006, 2008, 2010, and 2012. This ensures that there is enough time for the players’ careers to play out before evaluating them. We will start out by analyzing how each draft class’s ROTY winner compares to his peers in terms of MPG and total games played.
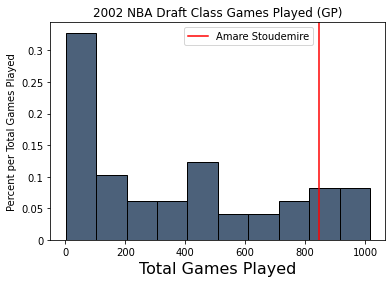
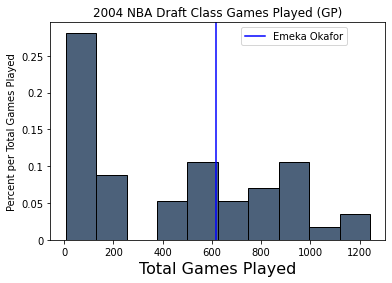
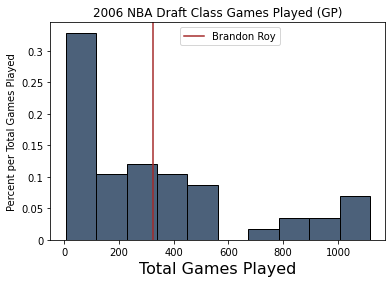
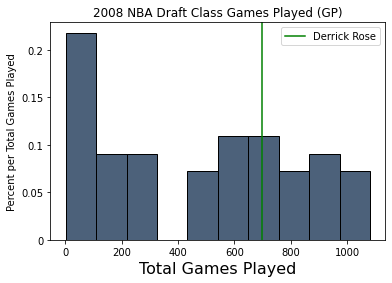
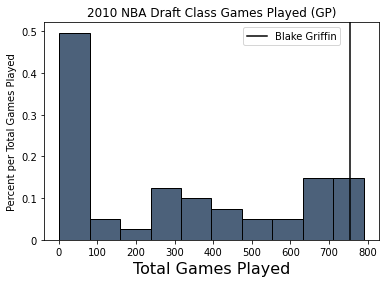
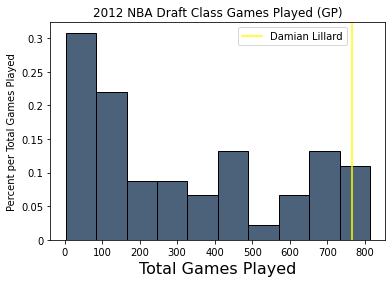
Above, we have the distributions of total games played for the players of each draft class, with the red line indicating where the ROTY winner for the respective draft class falls.
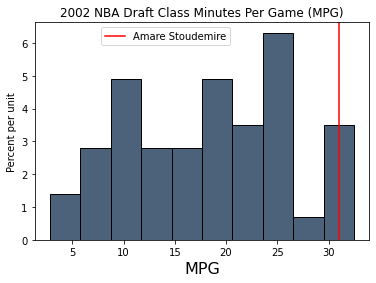
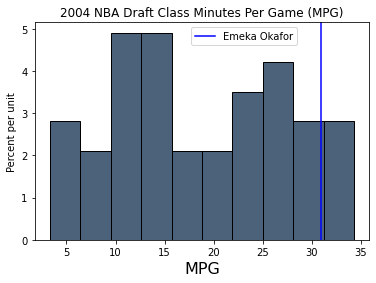
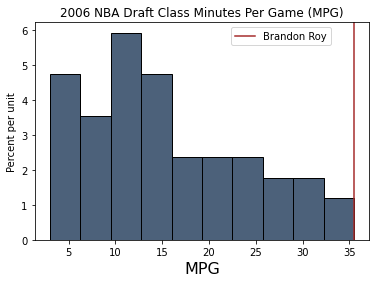
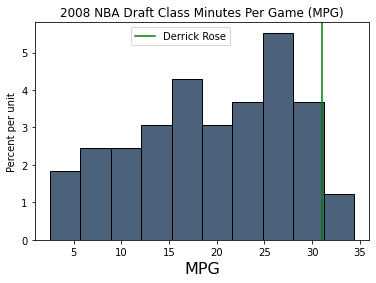
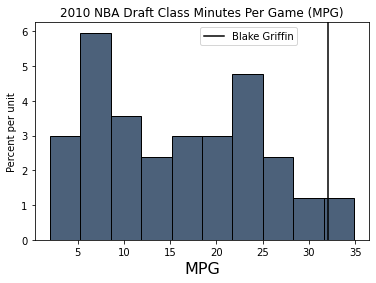
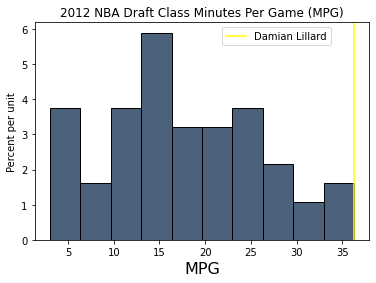
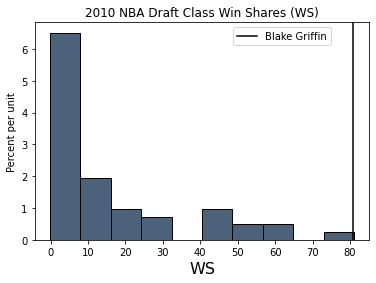
In these visualizations, we observe the distributions of MPG for every player of the corresponding draft class, with the red line once again representing the ROTY winner of that draft class. It’s also important to note that Blake Griffin is compared to the draft class of 2010 even though he was drafted in 2009 because he won the award for the 2010 draft class.
Now, how can we summarize these 12 histograms regarding the comparison between the ROTY and his draft class?
One good way to do this is to find the percentile of the ROTY winner regarding total games played and MPG relative to his peers. While this won’t give us everything, it will help us identify how long of a career and how important of a player each ROTY winner was compared to the other players who competed with him for the award. We can then analyze this to see if there are any patterns or trends.
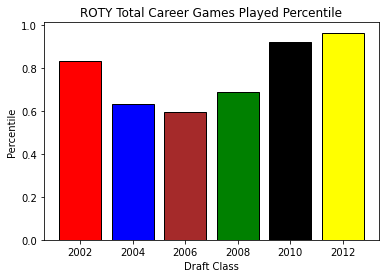
As shown above, the percentile of each ROTY winner regarding total career games played is significantly above 0.5. However, we can also see that the percentiles for most draft classes are significantly below 1.0. In fact, the average percentile from the 6 observed draft classes was 0.772. This tells us that while the ROTY winner’s games played was significantly above the average career length for his draft class, it was also significantly below the highest numbers.
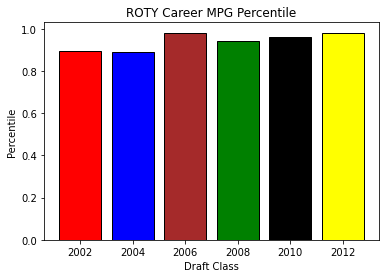
However, the MPG of the ROTY winners have percentiles close to 1.0. The average percentile for the observed draft classes ended up being 0.942, which is quite high. This shows us that these ROTY winners averaged playing times that were near the top of their draft classes, meaning that they were highly valued by their teams during the time they played.
Career Average Points Per Game (PPG)
While availability and longevity is an extremely important aspect of a player’s game, the player’s productivity is almost as essential if not more. A player’s career average PPG is the most basic NBA statistic regarding productivity. In fact, a lot of times it doesn’t tell the whole story regarding players. For instance, a player like Draymond Green doesn’t average many PPG but is still one of the most valuable players in the league for his team. The same thing can apply the other way around, where we see a player like Trae Young who averages a lot of PPG but has worse advanced stats because of glaring flaws in his game like defense. However, if we supplement PPG with advanced stats, which we will do in the next section, we get a better idea of both the player’s scoring output and his impact outside of scoring. So we will start by analyzing the distribution of PPG of each draft class and observing where in each distribution the respective ROTY falls. Finally, we will once again calculate the percentiles for each ROTY winner.
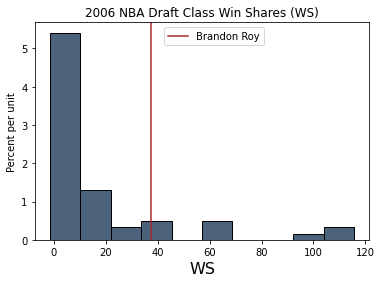
This also helps us separate the longevity of a player from his productivity while on the court. For instance, Brandon Roy, who was the ROTY winner from the draft class of 2006, unfortunately had a fairly short career due to injuries. However, while he was on the court, he was extremely productive, with Kobe Bryant even claiming that Roy “had no weaknesses in his game”.
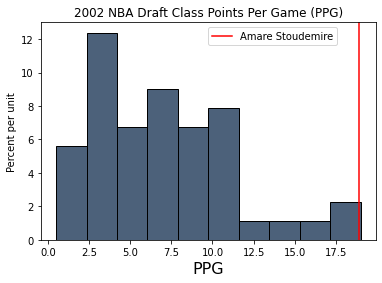
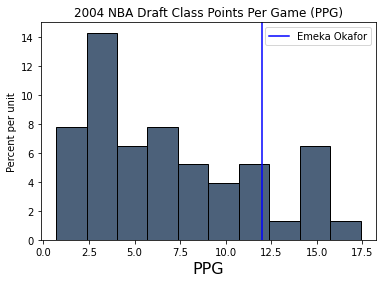
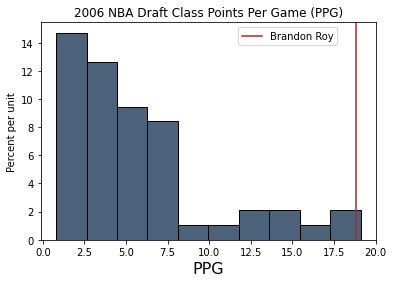
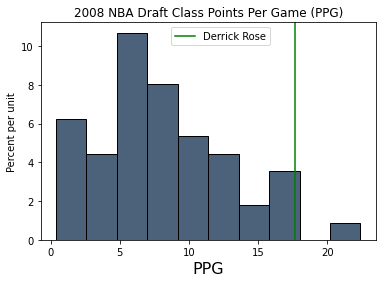
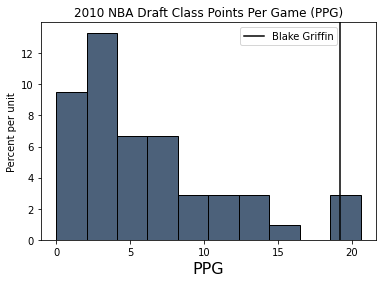
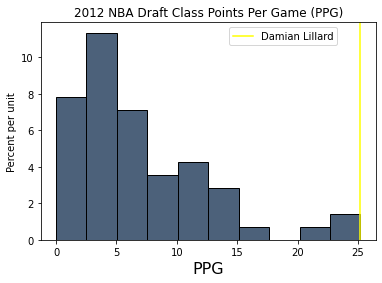
Above, we have the distribution of players’ PPG for each draft class, with the red line indicating the value of the ROTY for that class. Based on first glance, we can see that the ROTY winner for each draft is mostly near the top. Let’s take a deeper dive into this by calculating and visualizing the percentiles.
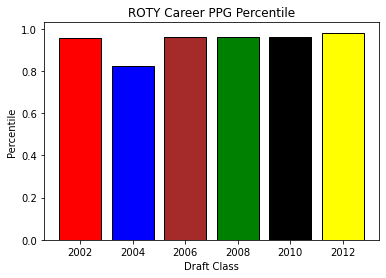
The average percentile for these 6 draft classes is 0.942. This indicates that from the classes we’ve observed, the ROTY winner tends to have scoring averages near the top of his class. While we can’t necessarily generalize this to apply to all years, we can see that from the information gathered, the ROTY winner seems to be a good indicator of having his average career scoring productivity be near the top of his draft class.
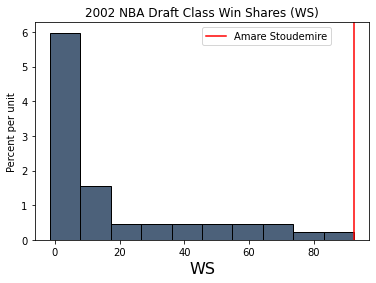
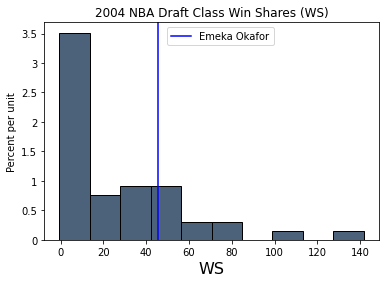
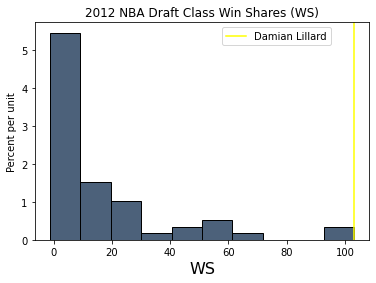
Career Win Shares (WS) and Box Plus-Minus (BPM)
Distributions of Win Shares:
Distributions of Box Plus-Minus:
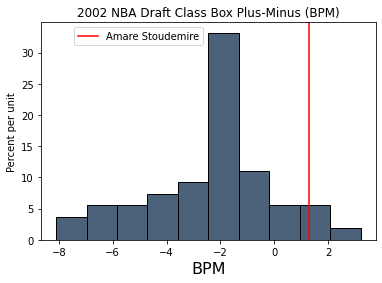
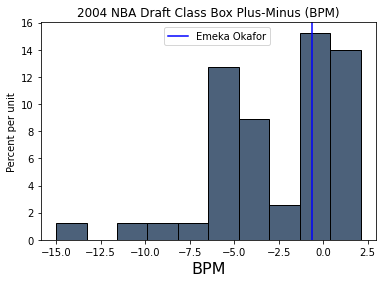
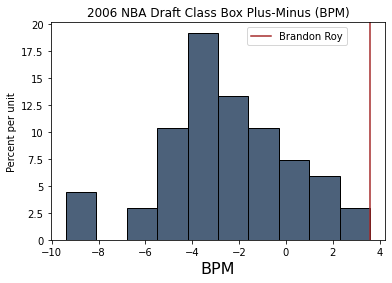
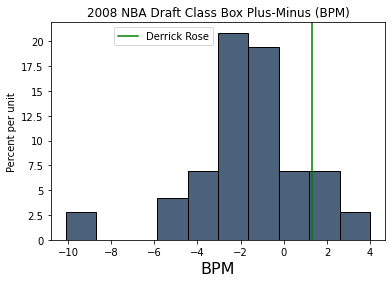
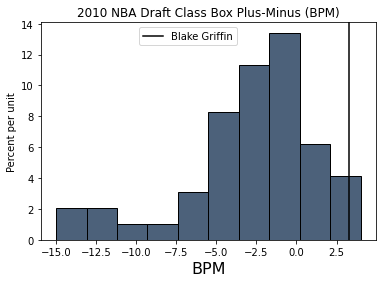
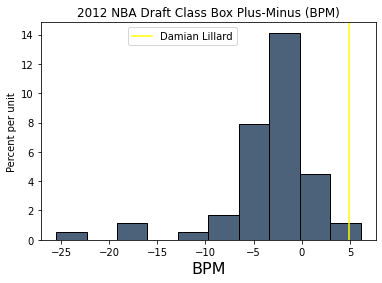
Above we have both the distributions of career averages for the advanced stats win shares (WS) and box plus-minus (BPM). Win shares give us an approximation of the number of wins contributed by a player over the course of an NBA season. Box plus-minus estimates the number of points per 100 possessions that a player contributes relative to a league-average player.
As we did for the other statistics, let’s see how the percentiles of ROTY winners pan out for these advanced stats:
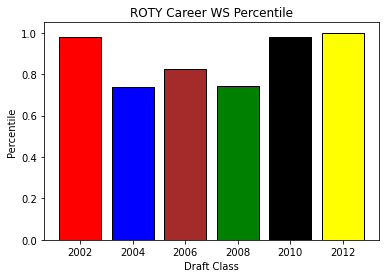
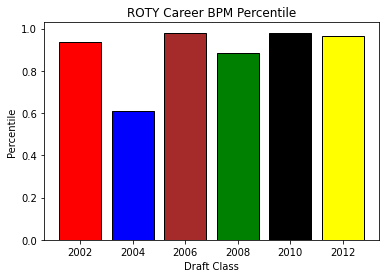
The average percentiles are 0.878 and 0.892 for career win shares and box plus-minus respectively. Based on this, we can say that while the career advanced stats of past ROTYs are above average, they tend to be significantly below players with top-tier advanced stats in their respective draft classes.
Thus based on this analysis, while we can’t generalize these stats to all ROTY winners, we get some valuable insight into how meaningful the ROTY award is. We can tell that the ROTY award winners seem to be near the top of their draft classes regarding career MPG and PPG, showing that they tend to be productive players and highly valued by their teams. However, when it comes to total games played and career advanced stats, they seem to be significantly better than average but also significantly worse than the top of their draft classes, indicating that the award doesn’t necessarily translate well to who has the longest or most impactful career.