A Tale of Two Rebounds
By Giulia Roy | November 11, 2022
Dunks and long threes draw the loudest cheers from fans at basketball games. However, sometimes the seemingly ordinary moments warrant the same applause, but fly under the radar. I have always thought that good box outs never receive the appreciation they deserve. Anyone who has played basketball before has heard that boxing out is “90% mental and 10% physical.” In a way, this makes boxing out the most easily learnable skill in the game, and yet it remains one of the hardest, because it requires so much grit and awareness. Boxing out is as valuable as it is challenging. If every player on a team boxes out properly after a shot goes up, that team is nearly guaranteed a rebound on that possession. In turn, a rebound grants another possession for that team, and one less possession for the opposing team. Boxing out drills are standard during basketball practices, but offensive rebounding drills are not. This may just be because boxing out requires technique, while offensive rebounding takes more strength, agility, and speed. However, it does beg the question: Do defensive and offensive rebounds have the same impact on the outcome of a game?
To answer this question, I analyzed data from the 2022-2023 WNBA and 2021-2022 NBA regular seasons. I first compiled the season total offensive and defensive rebounds for each of the twelve WNBA teams as well as their opponents. Then for each team, I calculated the ratio of team rebounds to opponent rebounds, as well as the difference of team rebounds minus opponent rebounds for each rebounding category. The four graphs below show this data separated by wins and losses.
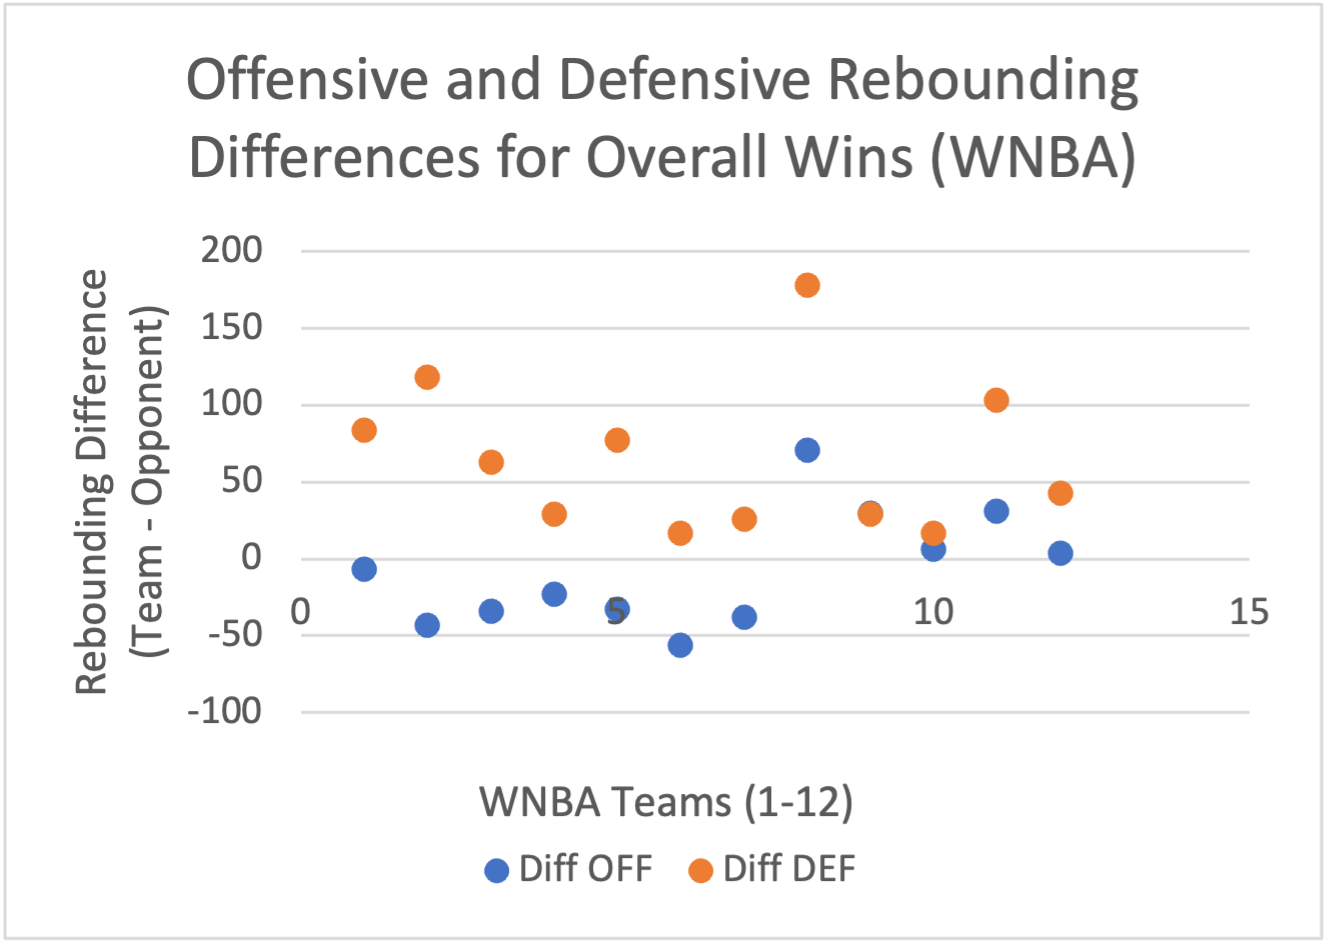
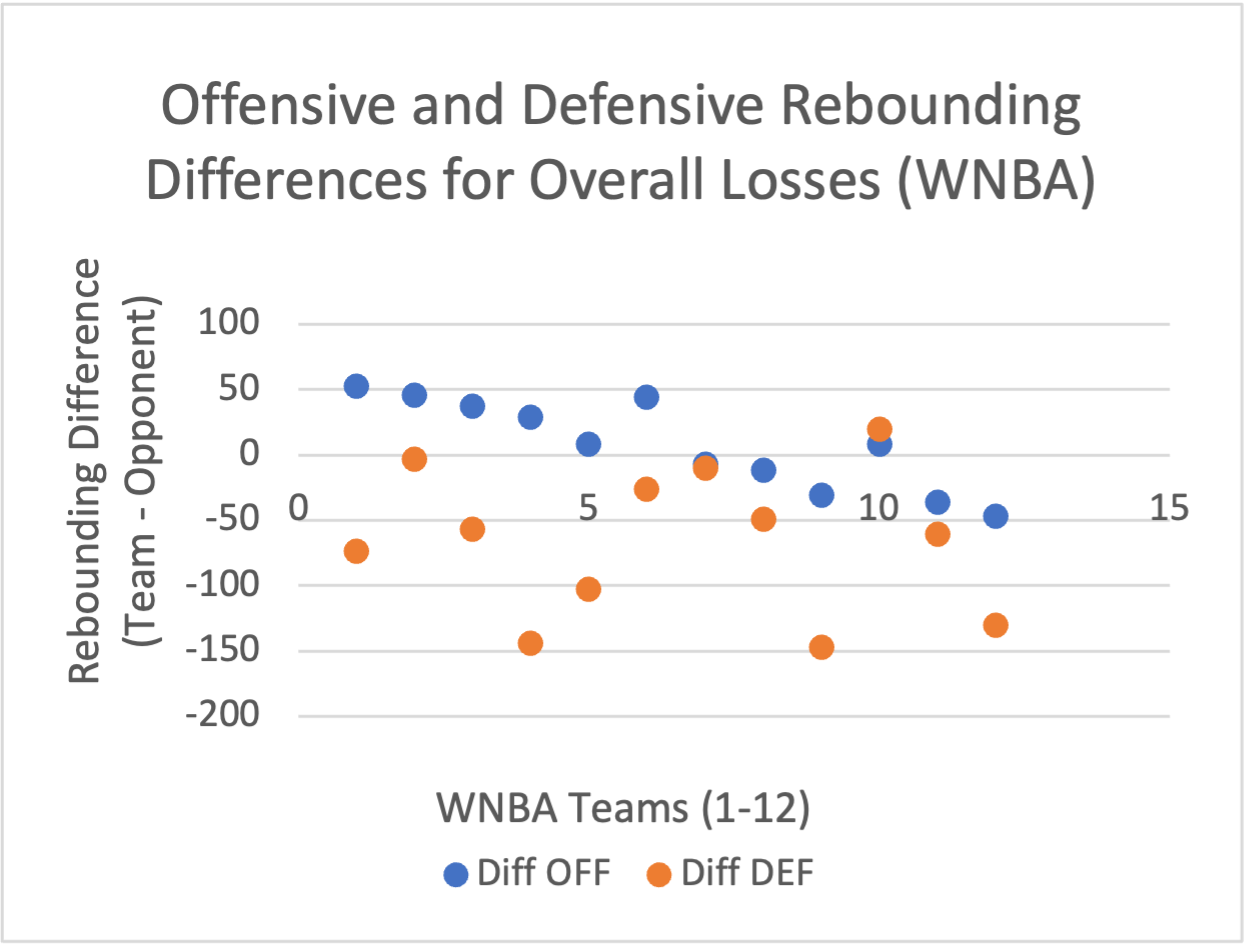
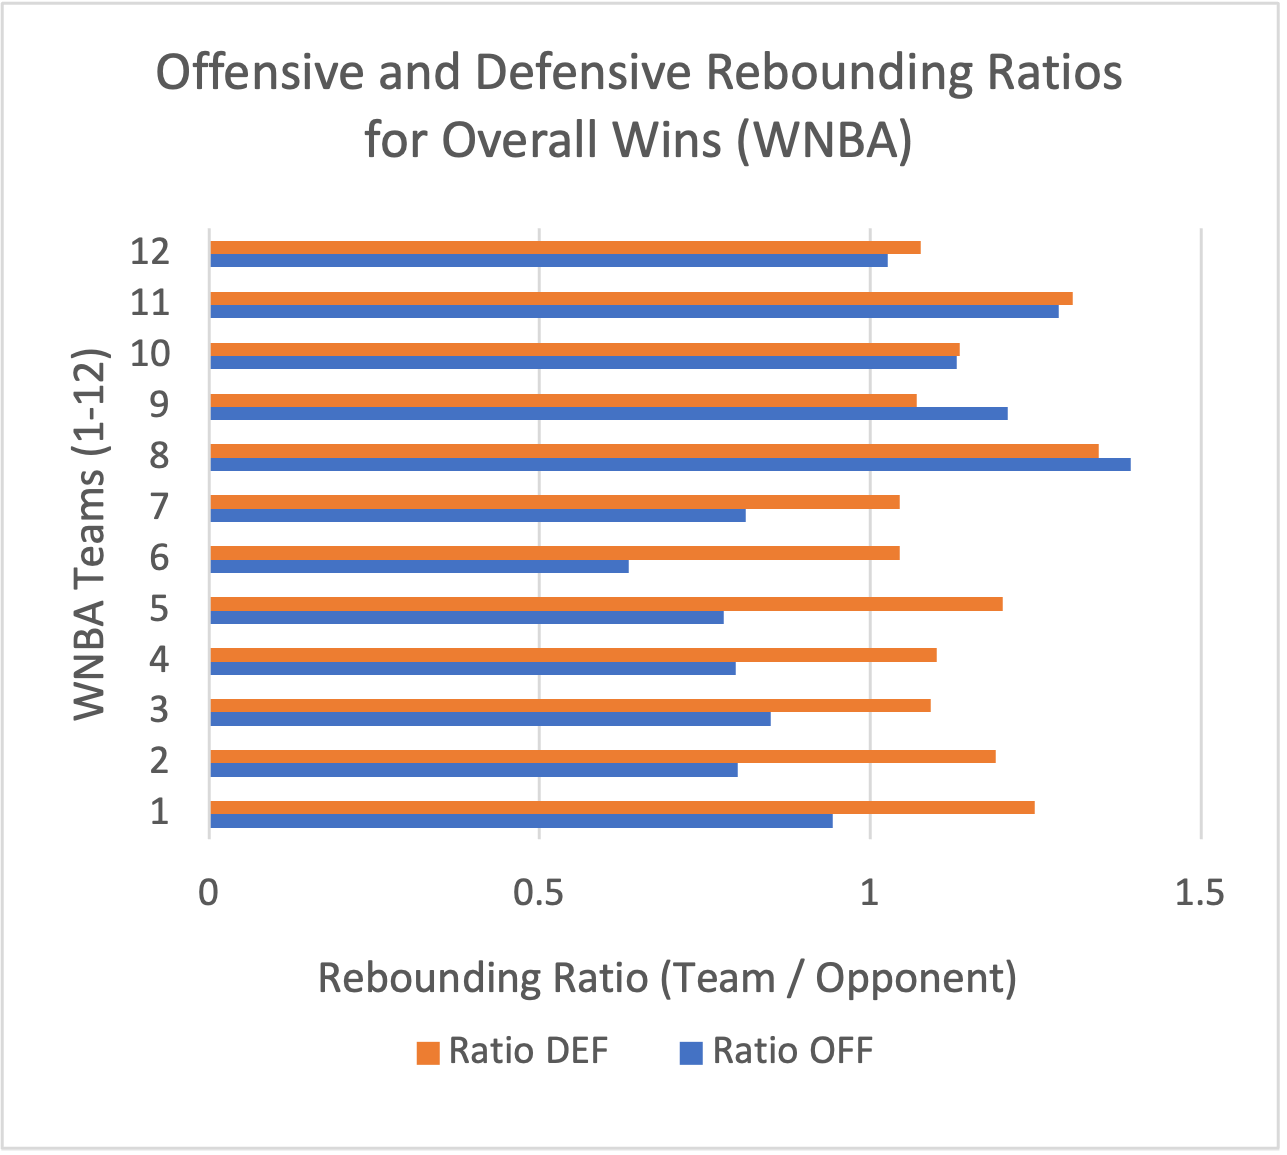
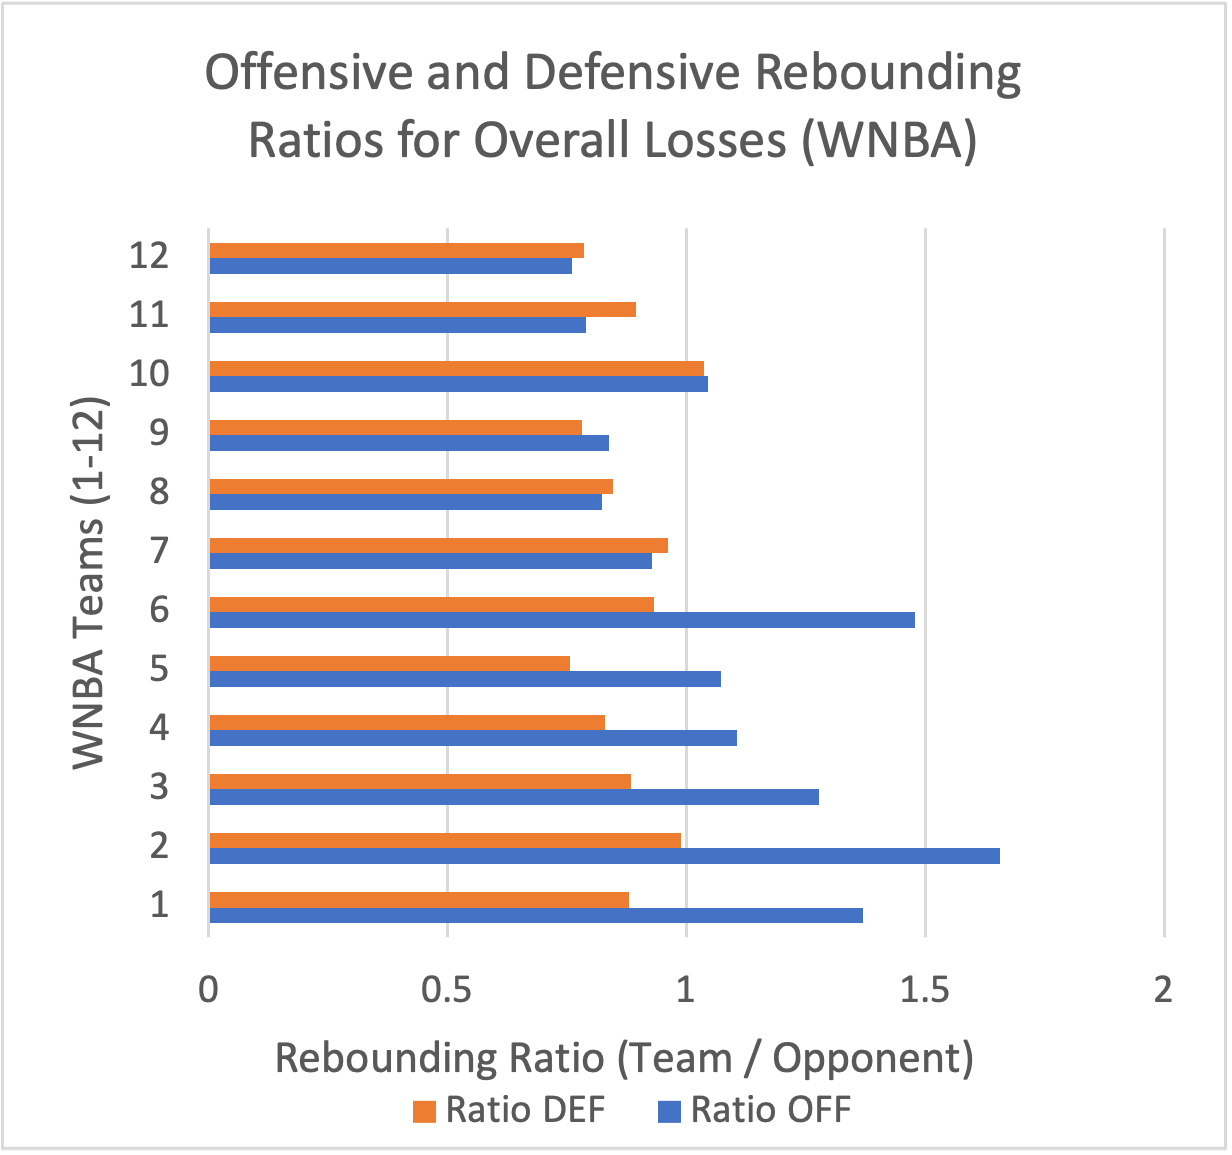
Teams consistently outrebounded their opponents on defense over cumulative wins but were defensively outrebounded by their opponents over cumulative losses. Interestingly, several teams were offensively outrebounded by their opponents across their season wins, and several teams offensively outrebounded their opponents across their season losses. This is not intuitive. One would expect teams to outrebound their opponents on both offense and defense when they win and to be outrebounded on both when they lose.
The WNBA has only twelve teams, and as a result there is less data to examine than for the NBA, which has thirty teams. Therefore, it is useful to explore the latest NBA data to see if the same trends appear.
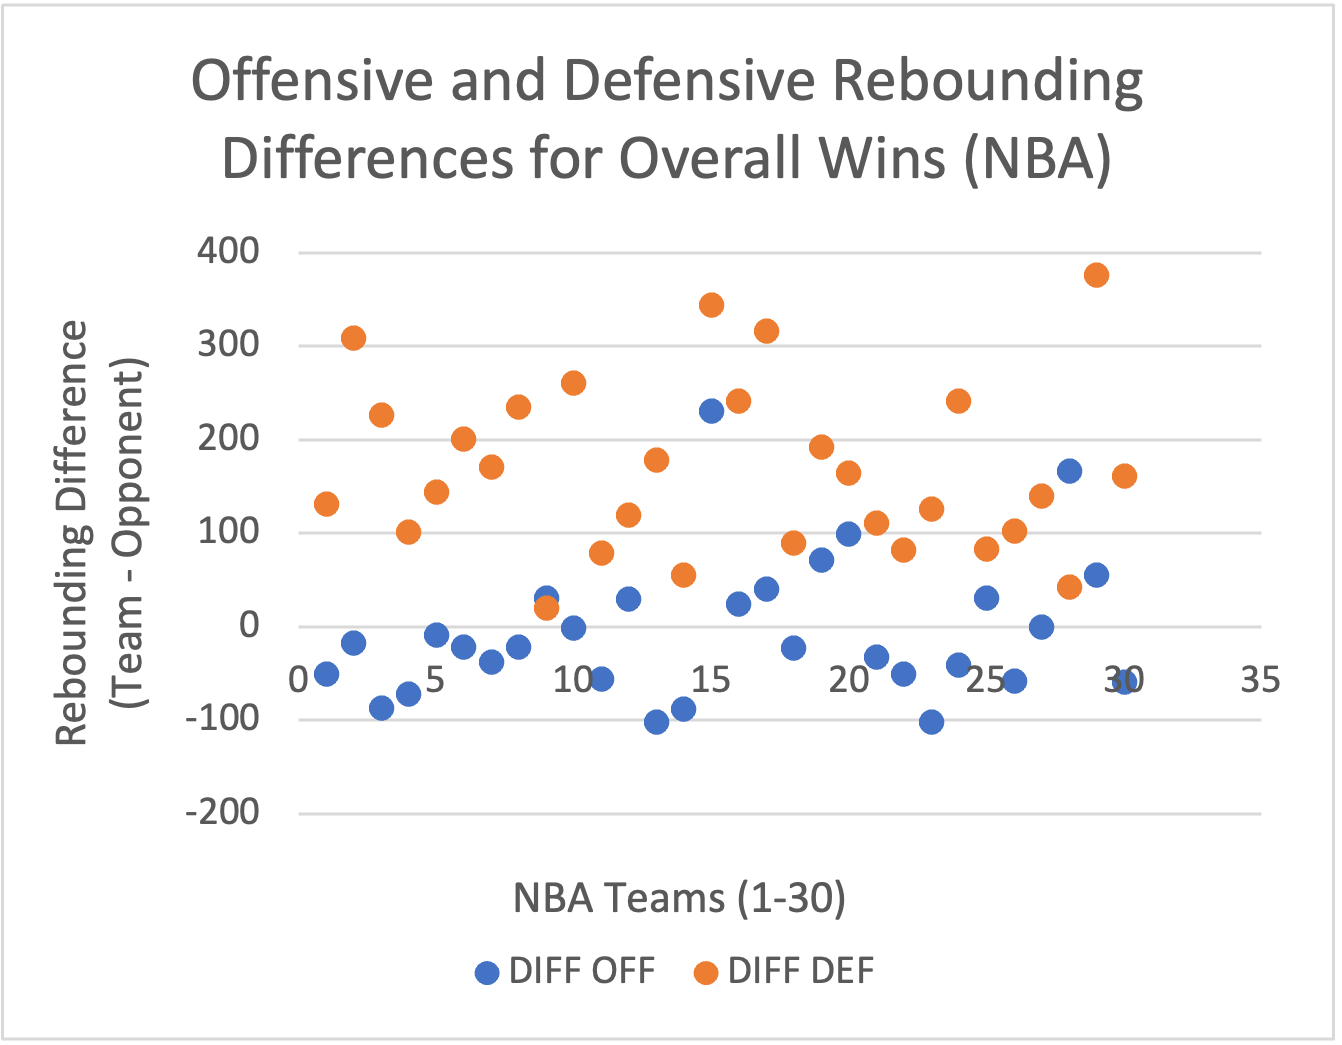
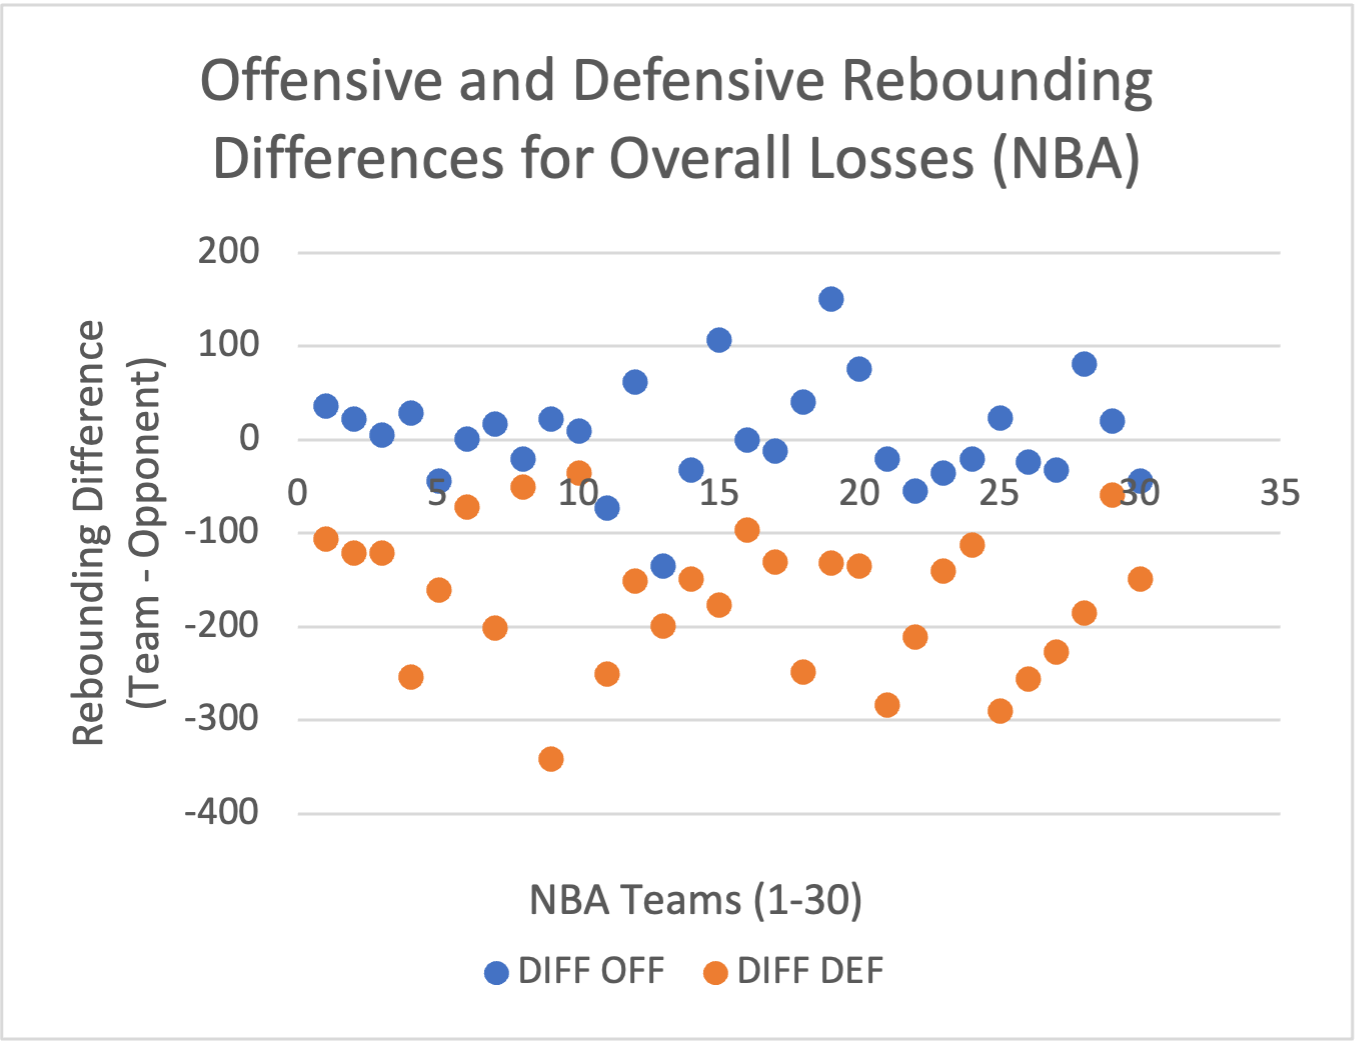
As the graphs above illustrate, the NBA data shows the same trends as the WNBA data. Overall, when teams outrebound their opponents defensively, they tend to win games despite being outrebounded offensively. Likewise, if teams get outrebounded overall defensively, they tend to lose despite outrebounding their opponents offensively. The above graphs only show the overall wins and losses across an entire season. To see if these trends were reflected on a per- game basis, I took each team in the WNBA and broke down their seasons one game at a time, separating them into wins and losses. The same trends did appear for most teams, however, there was less consistency. Below are the graphs of the rebounding differences for the Atlanta Dream.
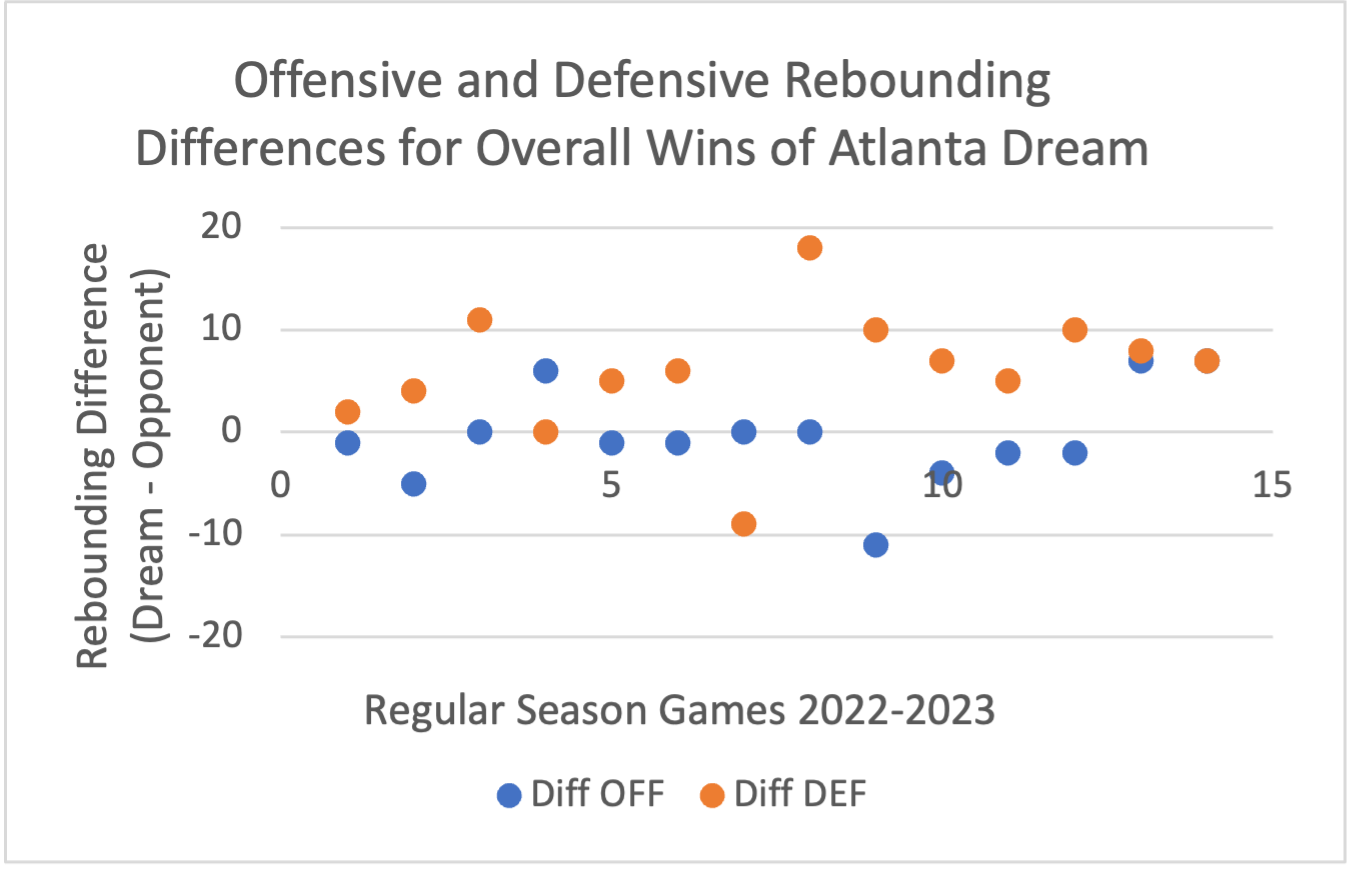
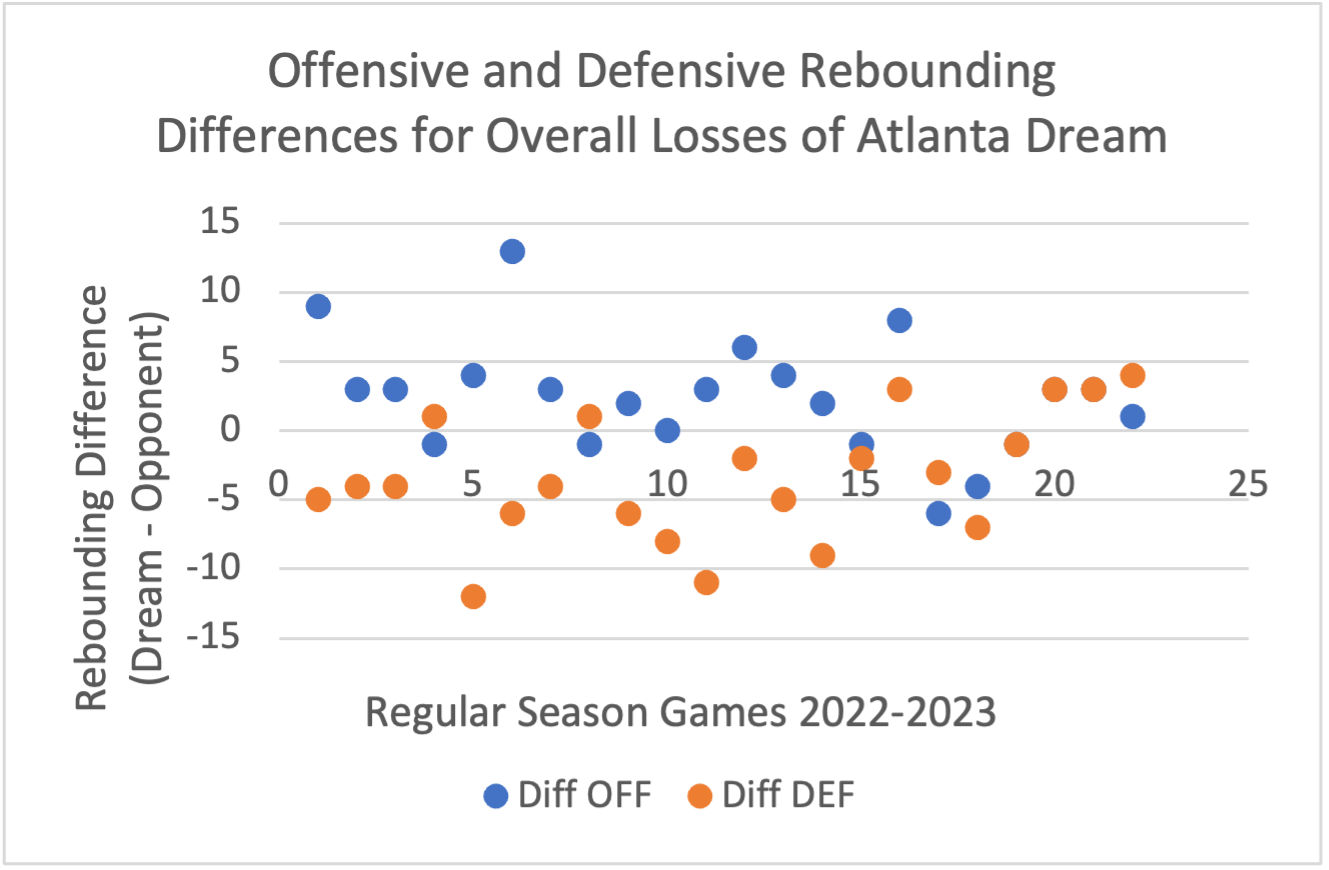
The consistent scatter of orange points above a rebounding difference of 0, and blue points below a rebounding difference of 0, in the games where the Dream won, mirrors the patterns seen in the overall season differences. As expected, the opposite pattern emerges in the games where the Dream lost. Clearcut patterns like these were not evident for each team, however the general trends did still appear. Given these opposing trends for wins and losses, I wanted to see if there was a correlation between defensive rebounding differences and win percentage, and offensive rebounding differences and win percentage. The graphs below show this correlation in the past regular season of the WNBA.
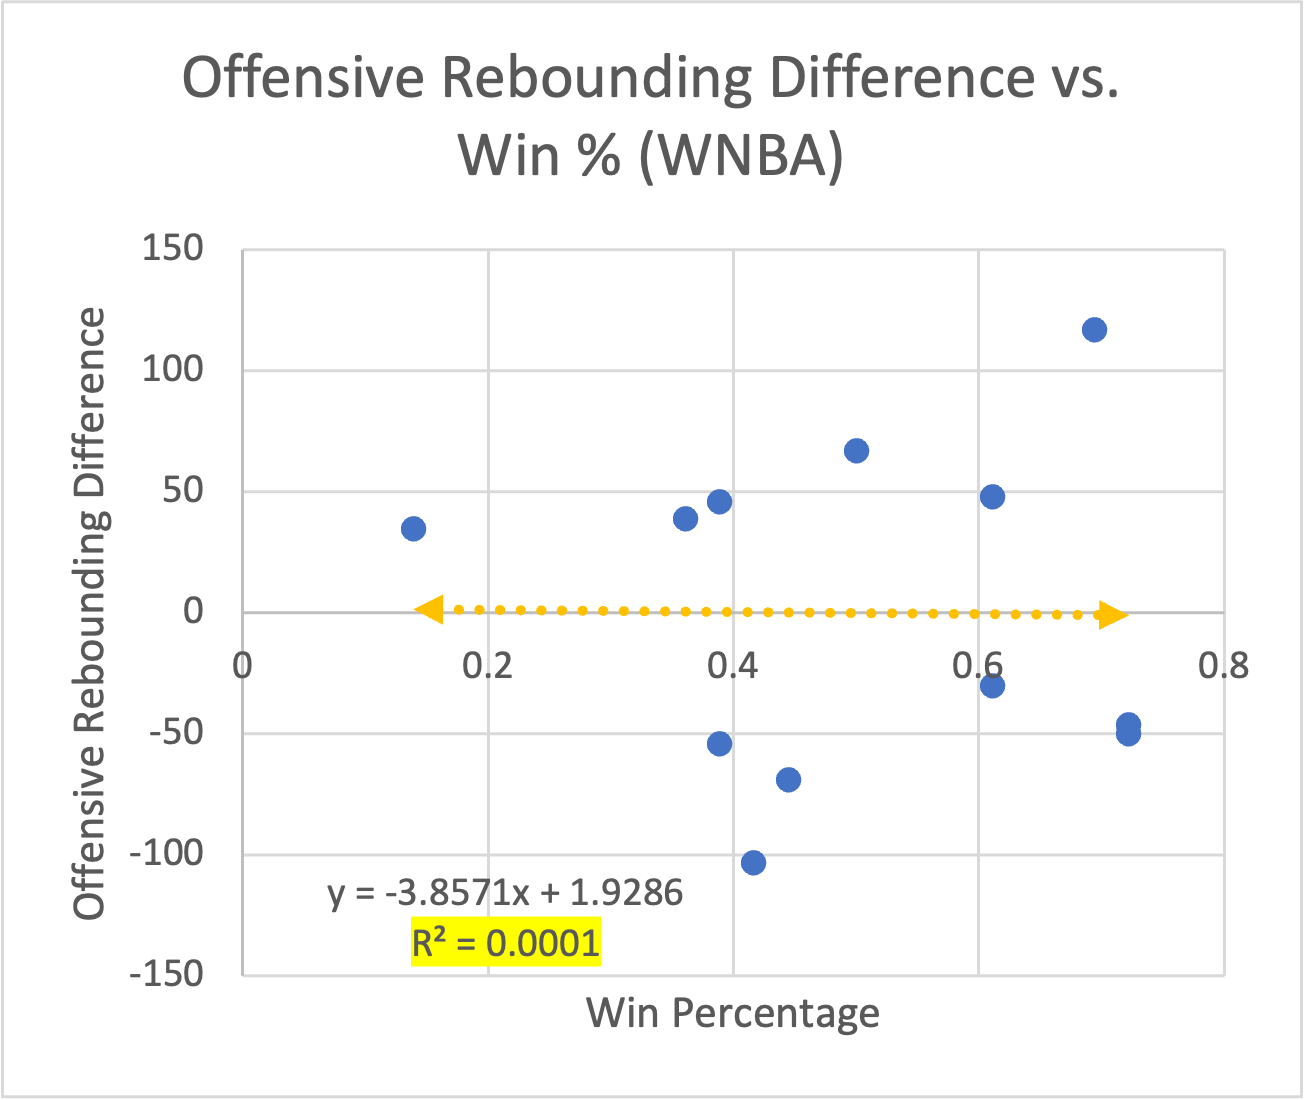
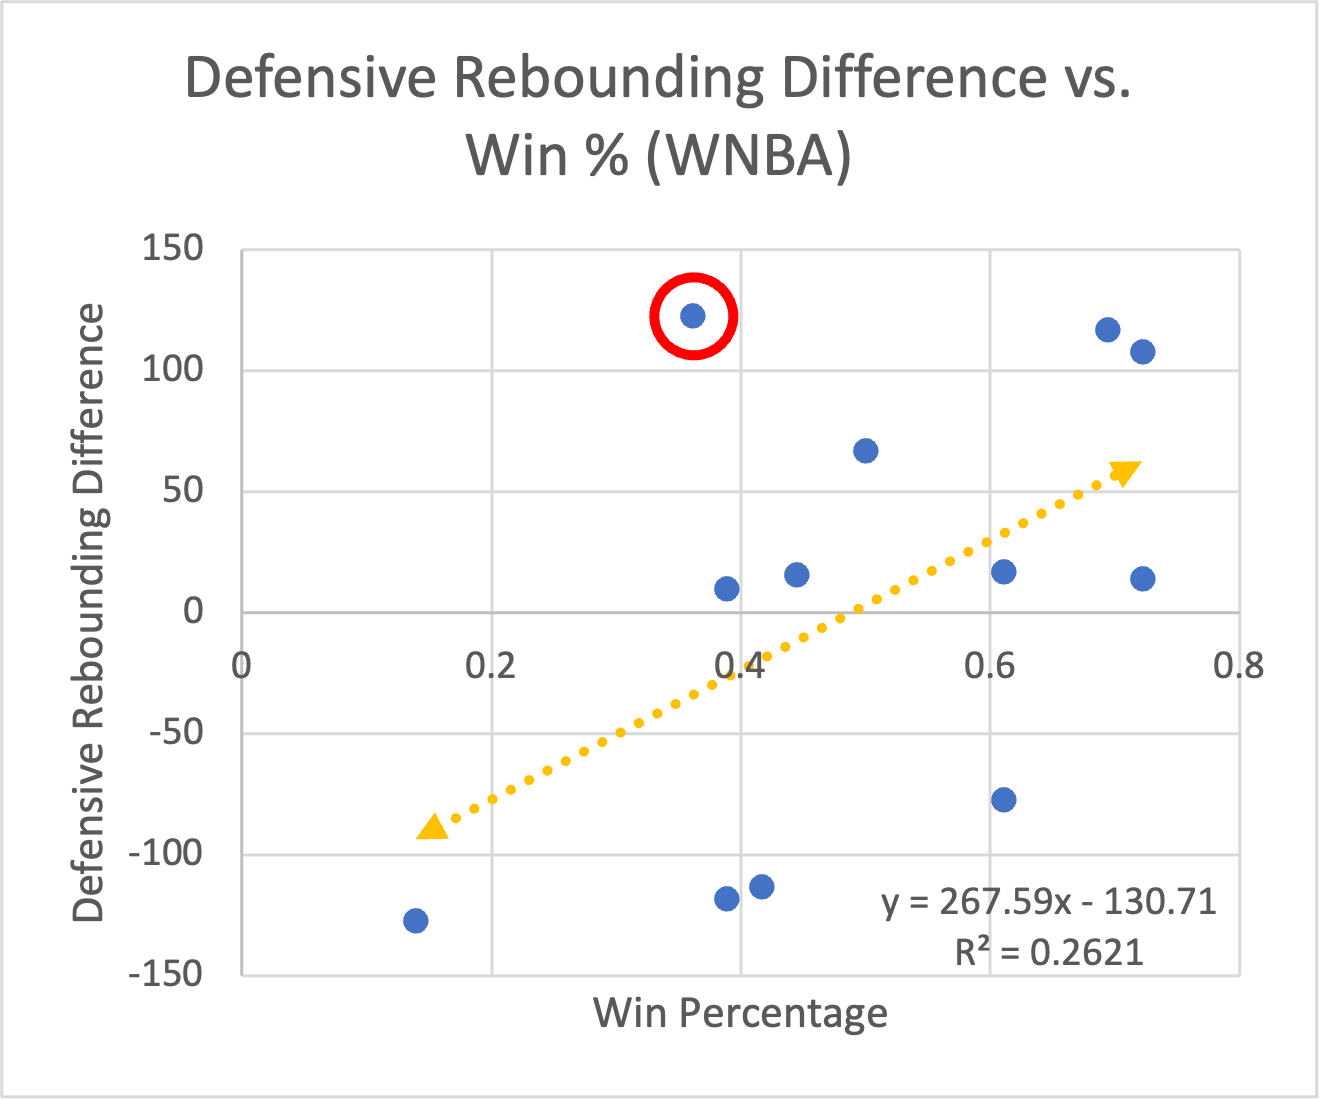
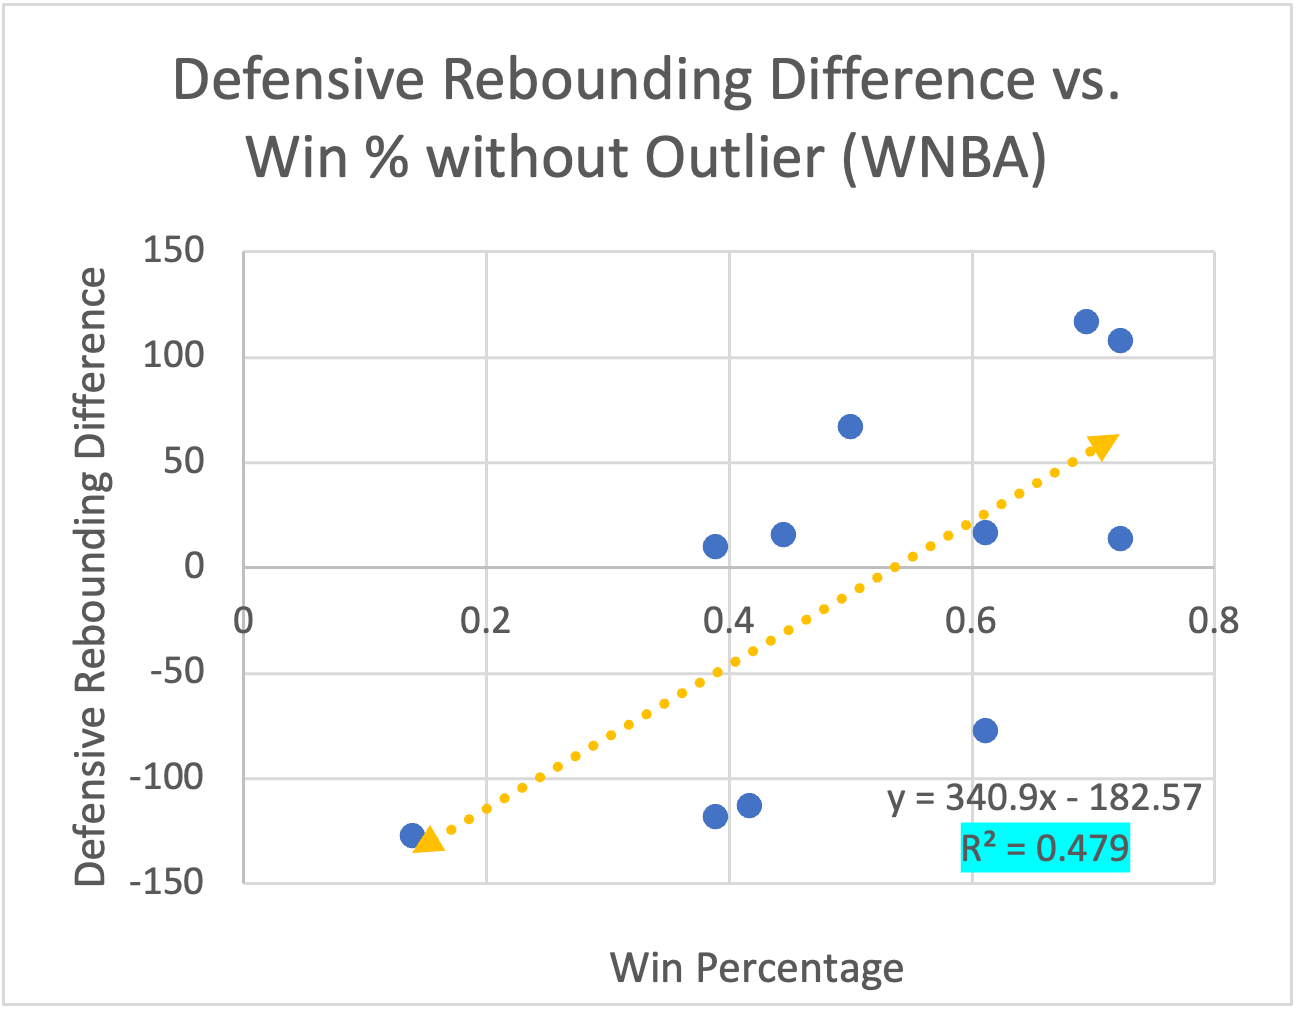
In the offensive rebounding difference vs. win percentage scatterplot, points are scattered randomly and there is a very low linear correlation of 0.01. On the other hand, in the scatterplot of defensive rebounding difference vs. win percentage, there is a definite positive, linear correlation. However, there is a very clear outlier in the data, indicated by the red circle. The Minnesota Lynx had a low win percentage of 0.36 and yet outrebounded their opponents on defense by a large total of 123 rebounds. Removing this outlier results in a much stronger correlation of about 0.69. This provides further indication that defensive rebounds have more of an impact on the outcome of a basketball game than offensive rebounds do. Again, the WNBA has limited data, so it is helpful to compare these trends with those from the past regular season of the NBA. The graphs below show correlation between defensive and offensive rebound differences versus win percentages in the 2021-2022 NBA regular season.
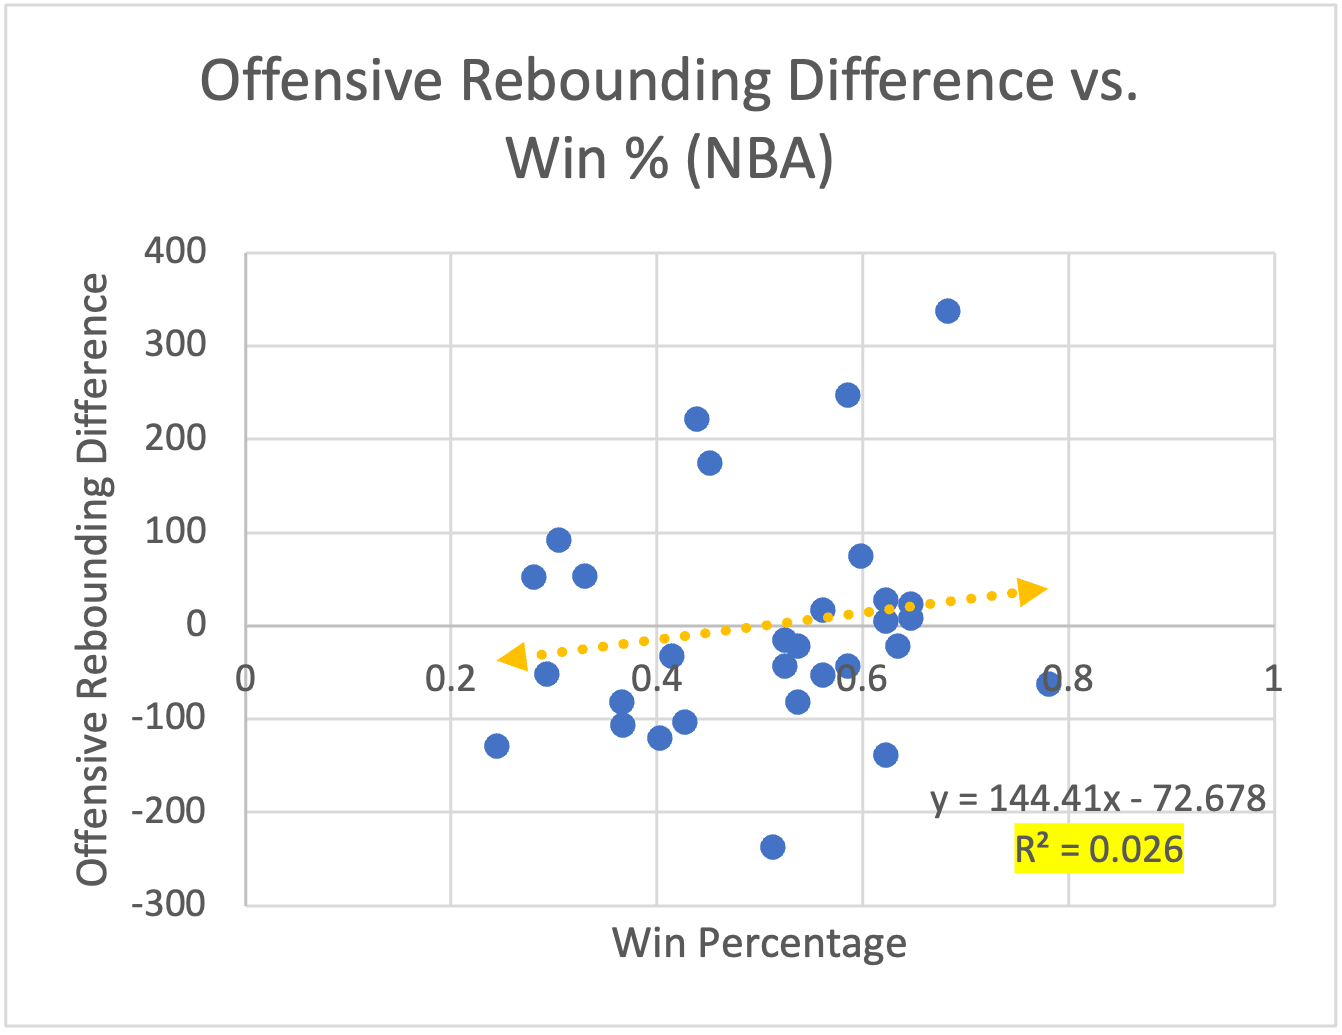
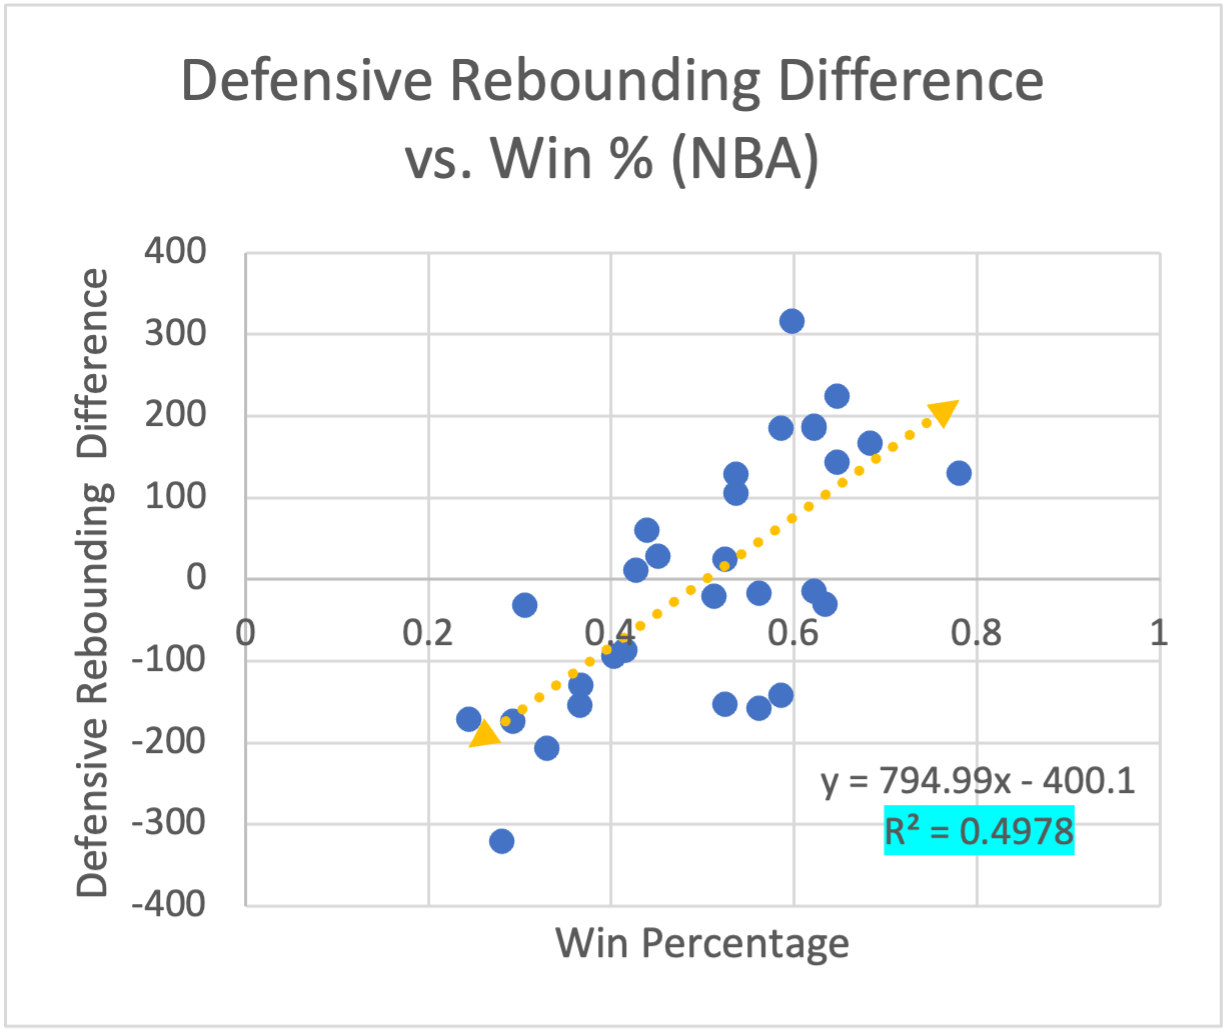
The patterns in the NBA scatterplots mirror those in the WNBA ones, with offensive rebounding difference vs. win percentage having a mostly random scatter, and thus a very low linear correlation, and defensive rebounding difference vs. win percentage showing a definite positive linear relationship, with a much stronger correlation. In fact, the correlation values for each scatterplot are impressively similar for the WNBA and NBA, as seen by comparing the highlighted r-squared values of the regression lines.
Analysis from the last regular season of both the NBA and WNBA seems to suggest that defensive rebounding has more of an impact on the outcome of a basketball game than offensive rebounding. While there was a weak correlation between offensive rebounding differences and win percentage, there was quite a strong correlation between defensive rebounding differences and win percentage. In games teams won, they tended to outrebound their opponents defensively, and in games they lost, they tended to be outrebounded on defense by their opponents. In addition, teams tended to get outrebounded offensively when they won, and tended to outrebound their opponents on offense when they lost.
Each rebound, whether offensive or defensive, can be viewed as another opportunity to score. The more opportunities teams have to score, the more likely they are to win games. One explanation for the trends observed above might be that the teams getting the extra offensive rebounds were not converting on the extra possessions. The extra opportunities to score may have been wasted, and therefore did not help the teams win games. Furthermore, an important distinction between defensive and offensive rebounds is that defensive rebounds can lead to fastbreaks while offensive rebounds cannot. Since fastbreak attempts yield a much higher field goal percentage than regular shot attempts do, extra fastbreaks can be the difference in a game. While rebounds can never tell the whole story of a game, they certainly tell a big part. Michael Jordan famously said, “defense wins championships,” after he won the 1991 NBA championship with the Chicago Bulls. Winning the defensive rebounding battle is no doubt a step towards dominating on the defensive end and setting a team up for success.