Captain Clutch
By Rohan Kathuria | November 11, 2023

With the 2023 ICC Cricket World Cup underway, it is the perfect time to look into the increasingly popular sport of cricket. Specifically, with all the talk regarding captains this year, let’s look into how being captain affects a player’s performance.
Before I dig into data analysis and visualizations, as explained to me numerous times by almost every person I have talked to here at Berkeley, most people do not know much about cricket so let me give you a quick breakdown.
Setting the Context
If anyone has ever told you to think of cricket as an Indian version of baseball, I urge you to forget about this statement and break off all ties with this person instantly. To begin, unlike most sports here in the US, the biggest aspect of cricket is matches between countries and not clubs. While there are club-based cricket leagues, such as the Indian Premier League, most competitions are based on country, such as the current ODI World Cup which happens once every 4 years.
If you have no idea what ODI is, don’t fret. ODI, or one-day international, is one of the 3 most prevalent formats of the sport of cricket. Yep, there are 3 different formats. ODI gets its name from the fact that one match typically lasts for one day or 8 hours, and it has 50 overs per inning with 2 innings, so 100 overs total. An over entails 6 balls bowled by the same bowler. The second format is a shorter one called T20, named after the fact that it has 2 innings with 20 overs each. The last and oldest format is that of test cricket which entails 4 innings (2 per team) and lasts for a maximum of 5 days. Importantly for this article, most countries have different teams for different formats, often with different captains for all 3 formats.
If there is one thing that I want you to remember it is that we will be looking into captains’ performances across all 3 formats and we will be focusing primarily on matches between countries and not clubs.
Performance Measures
Let’s now dive into some of the statistics that we will be using for this article. If you thought your learning was over, boy are you wrong. But don’t worry, I’ll try and keep it as brief as possible.
Let’s first understand the 2 key positions in the sport:
1. Batsman: A batsman is someone who, well you guessed it, bats. It is their job to score
runs for their team as the team with the most runs wins the game. They can either take
runs, such as a single or double, by running in between the 2 wickets across a pitch or
score a boundary, a 4 or a 6, by hitting the ball outside the boundaries of the field. There
are typically 5-7 batsmen on a team.
2. Bowler: A bowler’s job, well you guessed it again, is to bowl. There are 2 types of
bowlers, spinners who try and rotate the ball to confuse the batsmen, and pacers who use
the velocity of the ball as a mechanism to get the batsmen out. The 4-6 bowlers in a team
aim to take wickets (get the players out) while defending the runs that their team has
scored. A batting side has 10 wickets—10 players who can get out—before they are
bowled out and stop batting. A bowler can get a batsman out in 3 main ways:
a. Hitting the stumps/wickets: If a batsman misses and the ball hits the wicket, the batsman
is out.
b. Getting caught out: If a batsman hits the ball and a fielder catches it before it
bounces, the batsman
is out.
c. Leg Before Wicket (LBW): Well, you don’t need to know this right now, just
know that there is another
way for batsmen to get out and that if you drop the
phrase ‘I hate LBWs’ in a conversation with cricket
fanatics they will instantly love you.
- Side Note: A batsman can also get run out but that is not pertinent to this article.
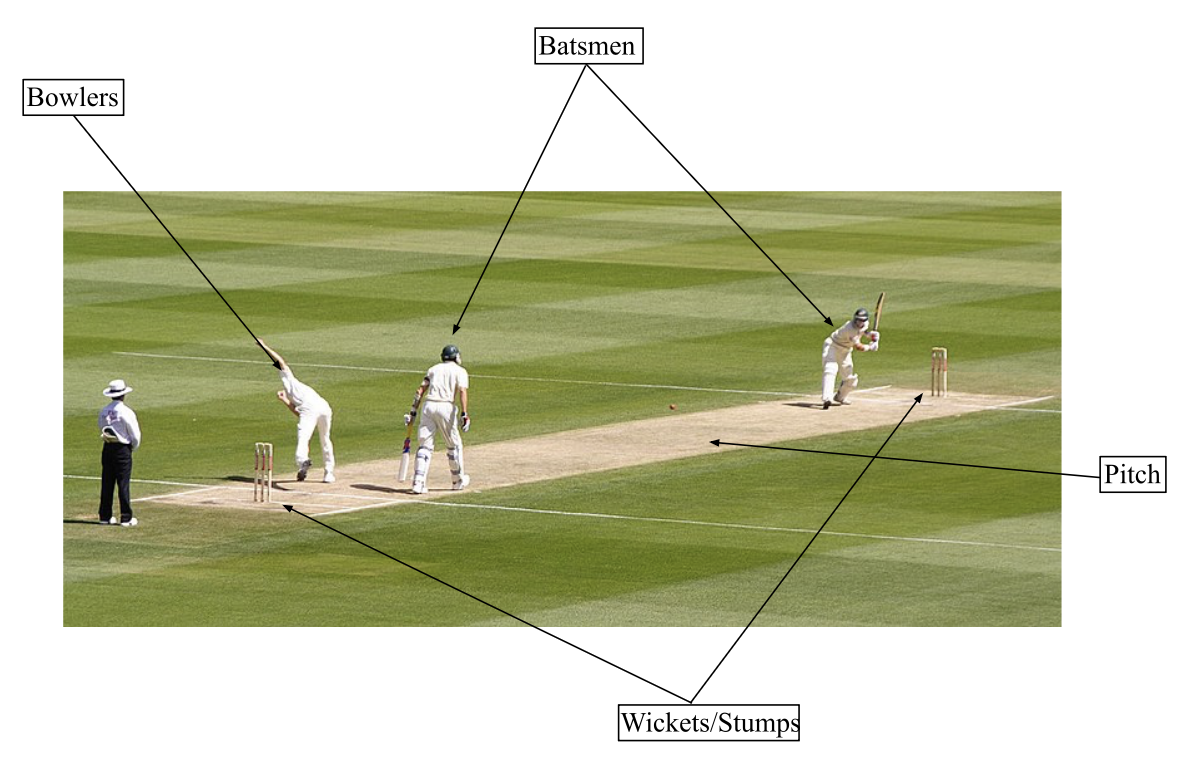
The picture below should put some of the phrases you’ve learned above in some more context.
Getting back on track, these are the key statistics we will be using:
1. Batting Average: The total number of runs a player has scored divided by the total
number of times a player has been out
2. Centuries: The number of centuries (100 runs or above) a player has scored.
3. Wickets Taken: Total number of wickets taken by a bowler
- The first 2 statistics are primarily for batsmen and the last one is primarily for bowlers.
Below is a sample performance report looks like for both batsmen and bowlers from the recent Asia Cup Final:
Batsmen:
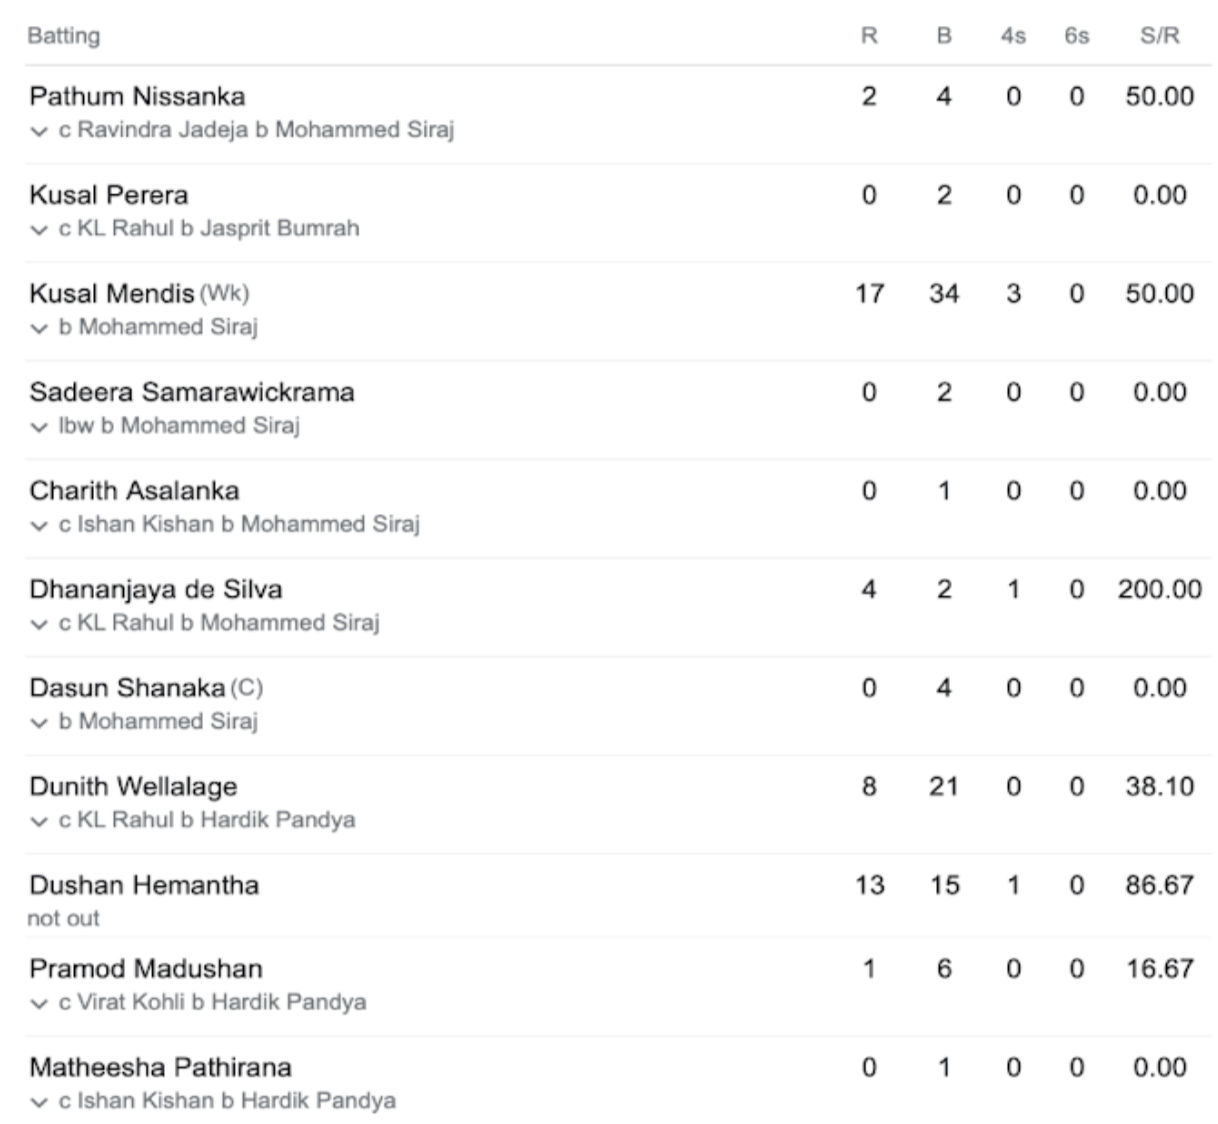
Where:
R = Runs
B = Balls Faced
4s = Number of 4s hit
6s = Number of 6s hit
Bowlers:
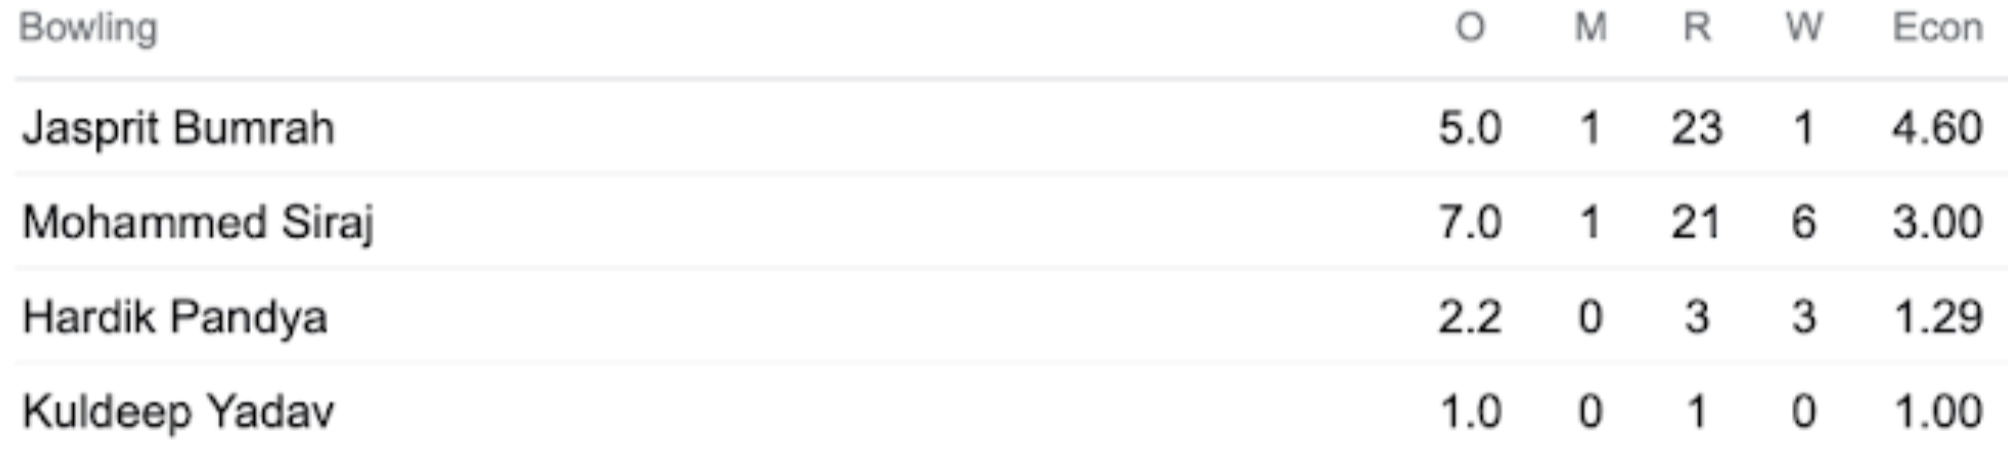
Where:
O = Over
M = Maiden Overs (No Runs
Given)
R = Total Runs Given
Econ = Economy (Runs per
over)
Now, as you eagerly wait for me to delve into the heart of the article, let me just explain why this topic is so important. Unlike most sports where being captain has more of a sentimental value than real value, in cricket it is vastly different. A captain plays a key role in selecting the players of a team, deciding who bats when and who bowls when, and taking responsibility for the team’s losses. Many big names in the sport, such as the all-time great Sachin Tendulkar, have not been able to handle the ginormous pressure that comes with being a cricket captain of a country.
Hopefully, you now have a gist of why I am researching this topic, so let’s dive in.
Batsman Boost
While bowling is a key part of the game, after all, it is half the sport, historically most captains have either been batsmen or all rounders. For instance, there is only one bowler captain at this year’s World Cup (Aussie skipper Pat Cummins). We’re thus going to focus predominantly on the impact of captaincy on batsmen, however, we will also briefly evaluate its impact on bowling.
The batting average is considered to be the most important statistic for a batsman. Similar to points per game in basketball or goals scored in soccer, the batting average is the easiest way to quickly determine how good a batsman is. The higher the batting average, the more runs you score and the better you are. However, unlike sports like basketball and soccer where you can impact the game in different ways such as assists, scoring runs is the only thing a batsman can do and so the batting average is even more important in some ways.
If we analyze the batting average for captains before and after their captaincy as compared to when they were captains, we get a graph like the one below.
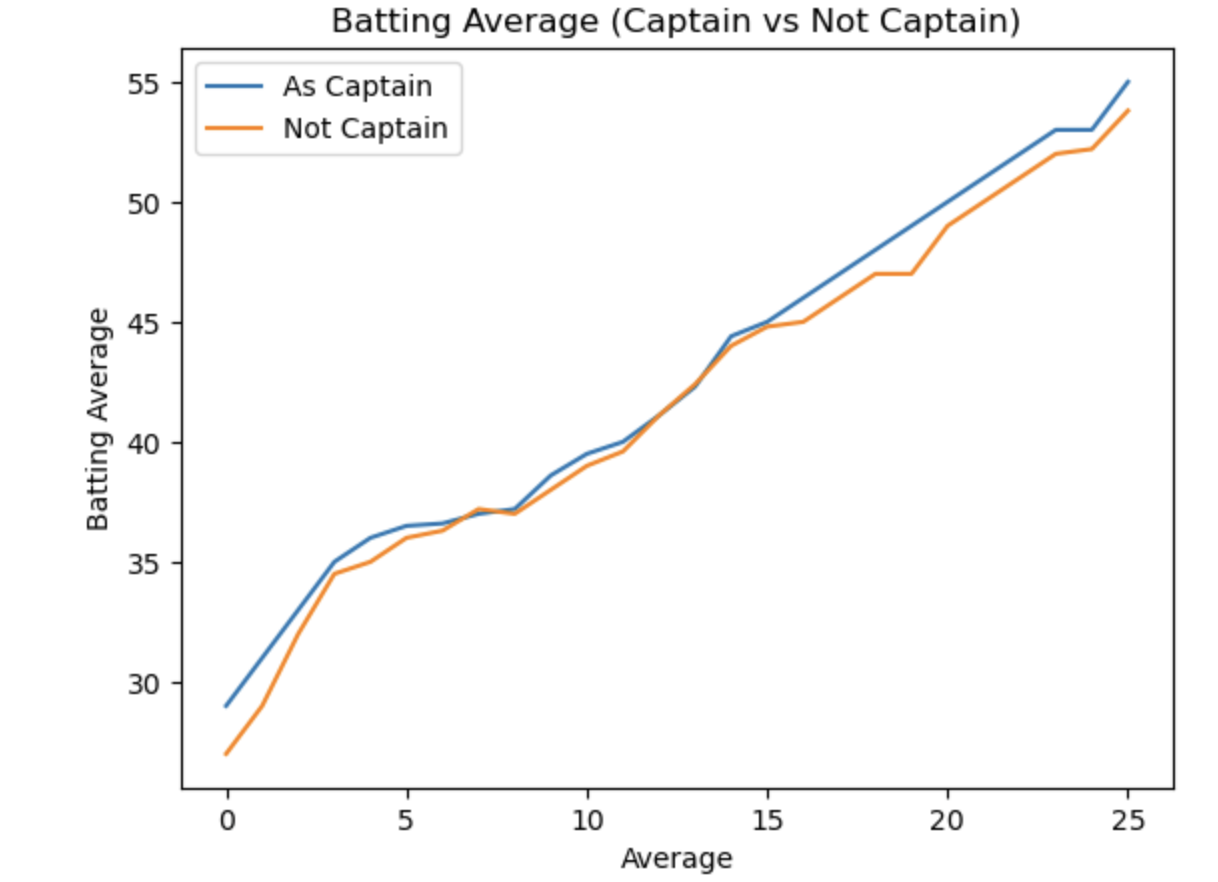
On average, we can see that being captain leads to a player having a higher batting average. Interestingly, we see that the batting average is higher for captains across a range of averages. Based on the y-axis values, captains averaging lower scores, such as below 35 runs per game, also improved their scores. This means that for both low-performing or below-average batsmen and high-performing batsmen, there is typically a bump in batting average, clearly indicating a positive relationship between becoming captain and scoring runs. While there are some abnormalities, we can see a consistent pattern of improvement for captains. From this, we can infer a wide array of things, such as batsmen improving under the pressure of captaincy or even batsmen getting more play time after becoming captain which would help them. Both of these are true for the case of Virat Kohli, who lies on the top right of the figure above and was known for clutch chasing performances when he was captain. On the other hand, the slight inconsistencies may also imply other effects of being captain. For instance, those who do not cope well with the pressure or lose focus on their batting due to the extra responsibility have performed worse during their captaincy. Coming back to Virat Kohli, he left his captaincy to refocus on his batting and he is now performing exceptionally so we may see the orange line at the top of the graph overtake the blue one.
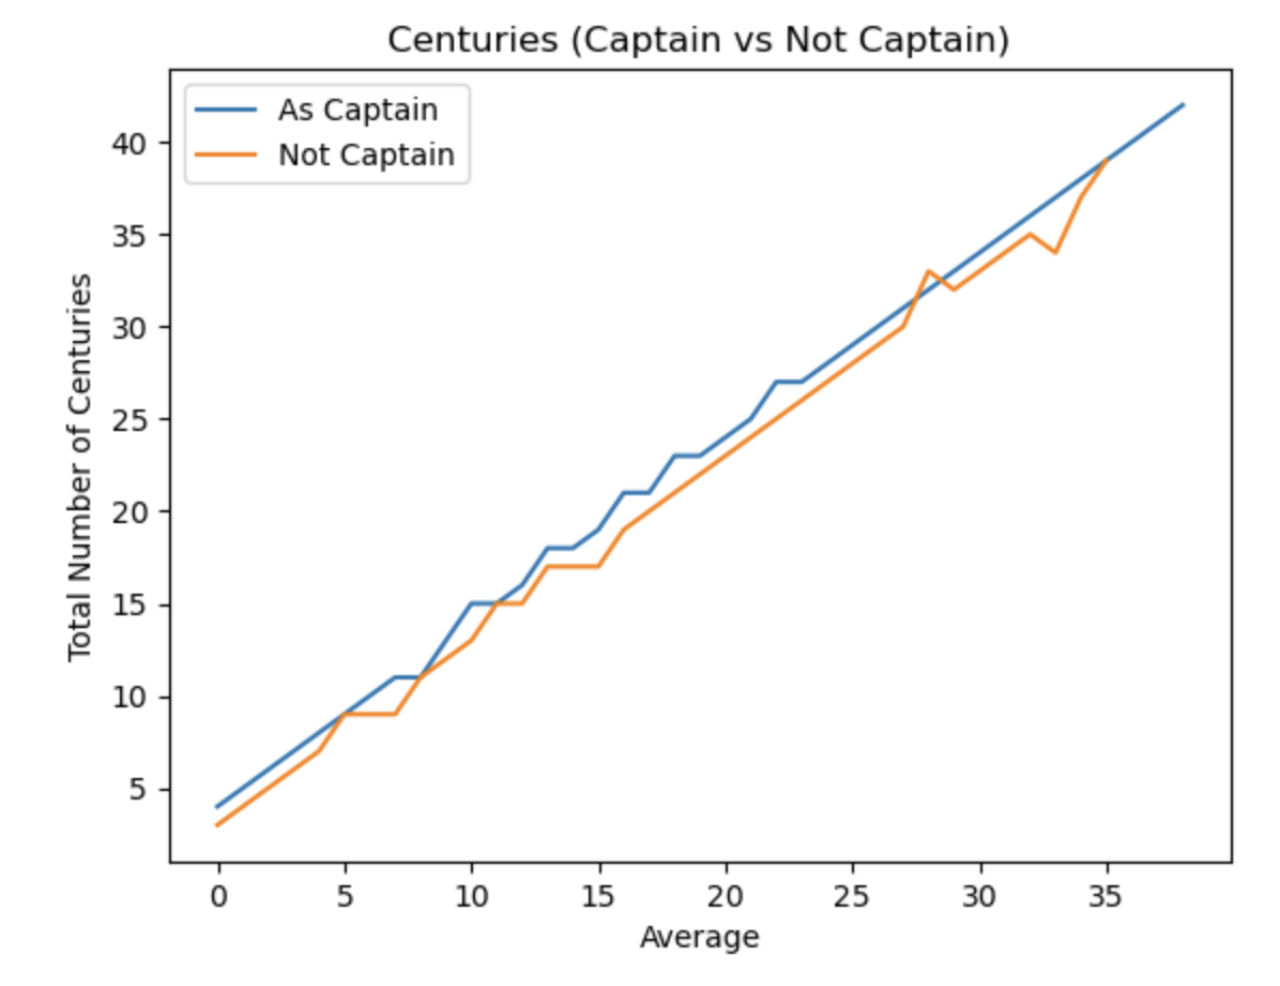
Our second graph shown above depicts the relationship between captaincy and the number of centuries scored. A century is when a batsman scores 100 runs in a single inning—again, reemphasizing the need to cut off your friend who told you cricket is like baseball. To understand what a century means, imagine a more difficult version of a basketball triple-double or a slightly easier version of a soccer hattrick. Again, similar to the batting average, on average we see a boost in centuries scored while captain as compared to when a batsman was not captain. The reasons for this, and the very few inconsistencies in the graph, could be due to the same reasons described for the batting average.
For the last batsman graphic, the image below from Amol Desai’s Medium article is a great indicator of the varying impact that being captain has on one’s batting average.
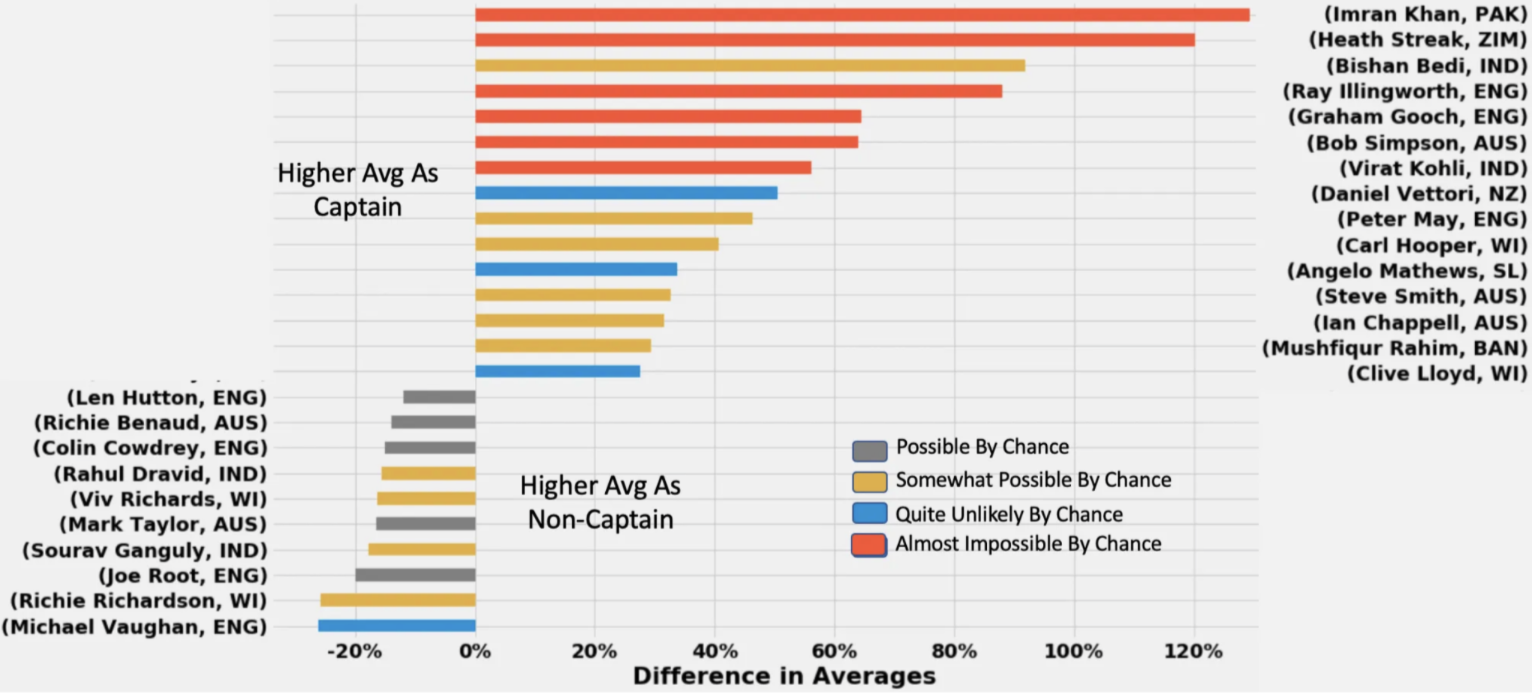
Unlike the earlier graphs which focused on captains at large, Desai’s figure gives a better glimpse of specific instances of captains and their performances. We can see how some current big names in cricket, such as Virat Kohli and Steve Smith improved significantly under captaincy, while some legends of the sport such as Viv Richards and Michael Vaughan actually had worse batting averages after becoming captain.
Wicket Wonder
Now that we have determined that captaincy has an average positive statistical impact on a batsman’s performance, let’s see if the same stands for bowlers. While our dataset for bowling captains is significantly smaller than that of batting captains, we can still analyze how being captain affects the most important aspect of bowling: wickets.
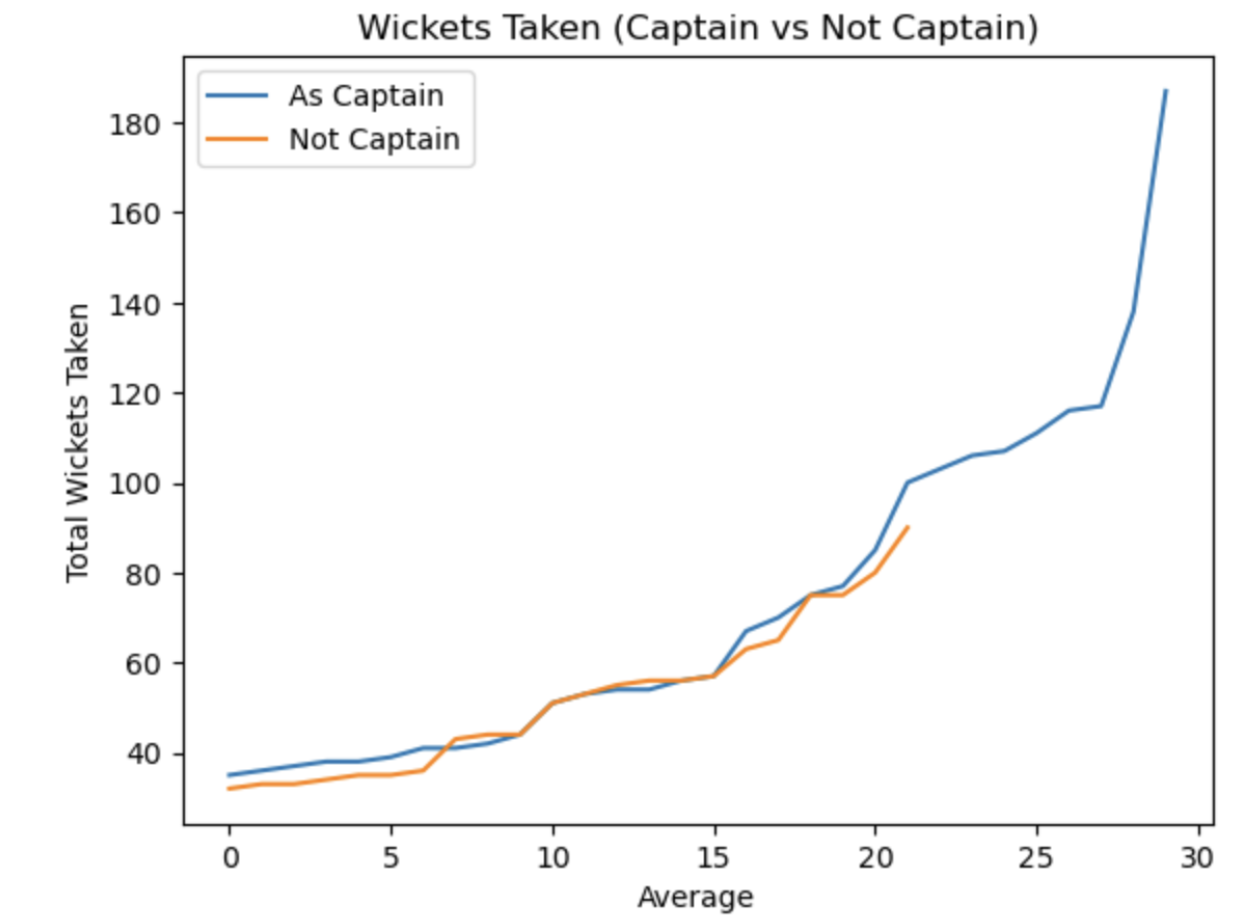
The figure above shows the relationship between wickets taken for captains as compared to not being captain. While we do see a greater initial variation for wickets than batting average or centuries, in general we can observe that there is a positive difference between wickets taken under captaincy. Again, this may be linked with higher performance under pressure or more consistent playing, among more factors.
A quick interesting observation: Do you see that our blue wickets curve (for captains) is a steep incline at the end? That is to take into account former Pakistan captain Imran Khan (shown in the image below), who shattered the test captain wicket record with 187 wickets. Even more interestingly, you’ll also see Imran Khan’s name at the very top of Desai’s batting figure, above names like Virat Kohli and Steve Smith, juist further highlighting the dominance of Pakistan’s world cup winning captain. And if you’re wondering where you’ve heard the name Imran Khan, what makes him somehow even more interesting is that he was the Prime Minister of Pakistan up until last year!

Conclusion
Be it bowling or batting, if there is one thing that our analysis has told us it is that becoming captain leads to players performing better on average. While we specifically know that batting averages, centuries, and wickets improve during captaincy, this trend may also apply to other performance statistics such as bowling economy and batting strike rate. The reasons for this exact difference, however, can be extremely varied, such as the aforementioned pressure performance and more consistent playing time.