Geographic Trends in the World of College Football Recruiting
By Grace Lytle | November 2, 2022
Over the recent years, the hobby of watching the college football recruitment process has gained almost as much momentum as watching the sport’s season itself. For any late high schooler, recruited athlete or not, choosing a college requires consideration across a range of categories; size of school, weather, job opportunities, academics, and social life all factor into making a college decision. However, for those who are committing to play D1 football at the schools with the top recruiting classes, the football program itself may have a bigger swing than some of these other factors. This article will analyze some of these trends across college football recruiting, and reveal whether any of these patterns are geographic in nature.
247Sports provides a recruiting class ranking each year which takes into account top rated recruits. This article will take a closer look at any school that has been ranked in the top 25 recruiting class* in the last five years. 247Sports analyzes the recruiting classes of over 200 schools.
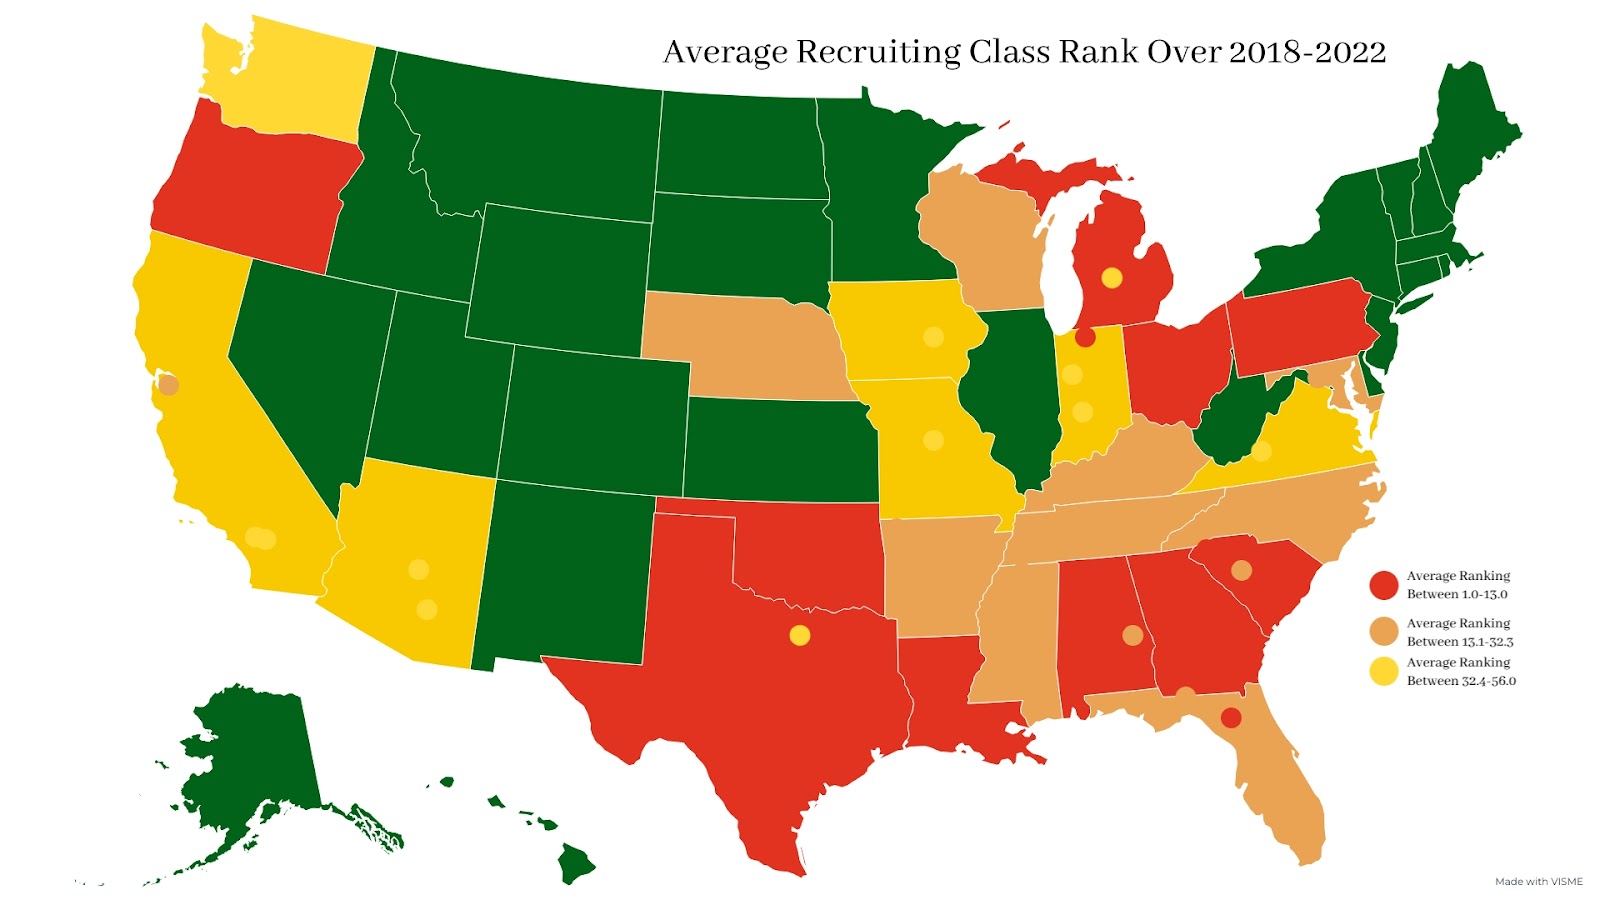
This map demonstrates the average recruiting class rank per school over the last five years. Schools represented in red have an average recruiting class rank between 1st and 13th, schools represented in orange have an average recruiting class rank between 13.1 and 32.3, and schools represented in yellow have an average recruiting class rank between 32.4 and 56th. The state is shaded in the color of the majority of schools, or in the case of an even split, the higher ranking school in that state.
The Fiske Guide to Colleges is often used by prospective students in learning surface level information about schools including average debt, size of school, anecdotal commentary about student experience, overall quality of life, social life, and academic ratings, among other information. As a concise metric for quality of life at the schools being considered, this article will use a sum of 2021 Fiske Guide to Colleges’ ratings for quality of life, social life, and academics, which are all rated on a scale from 1-5, with 0.5 increments available. This allows for a maximum score of 15.
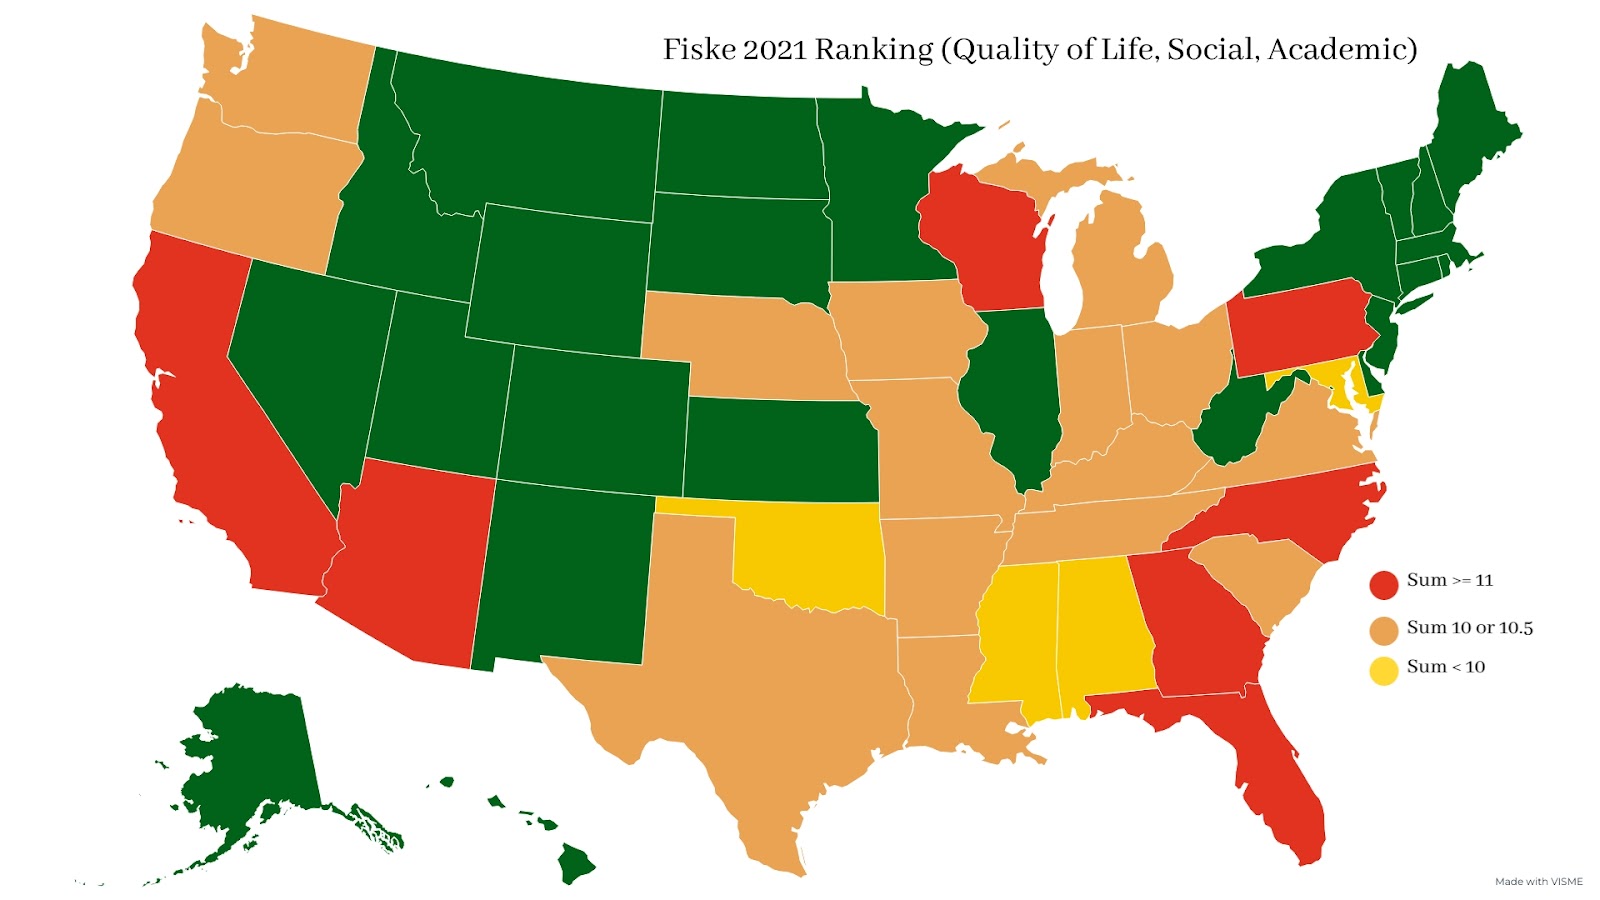
The map above demonstrates the Fiske rating on behalf of each state. In states with multiple schools, the average of sums was taken. States in red represent a high rating, with a sum greater than or equal to 11. States in orange indicate a middle rating, with a sum of either 10 or 10.5. States in yellow indicate a lower rating, with a sum less than 10.
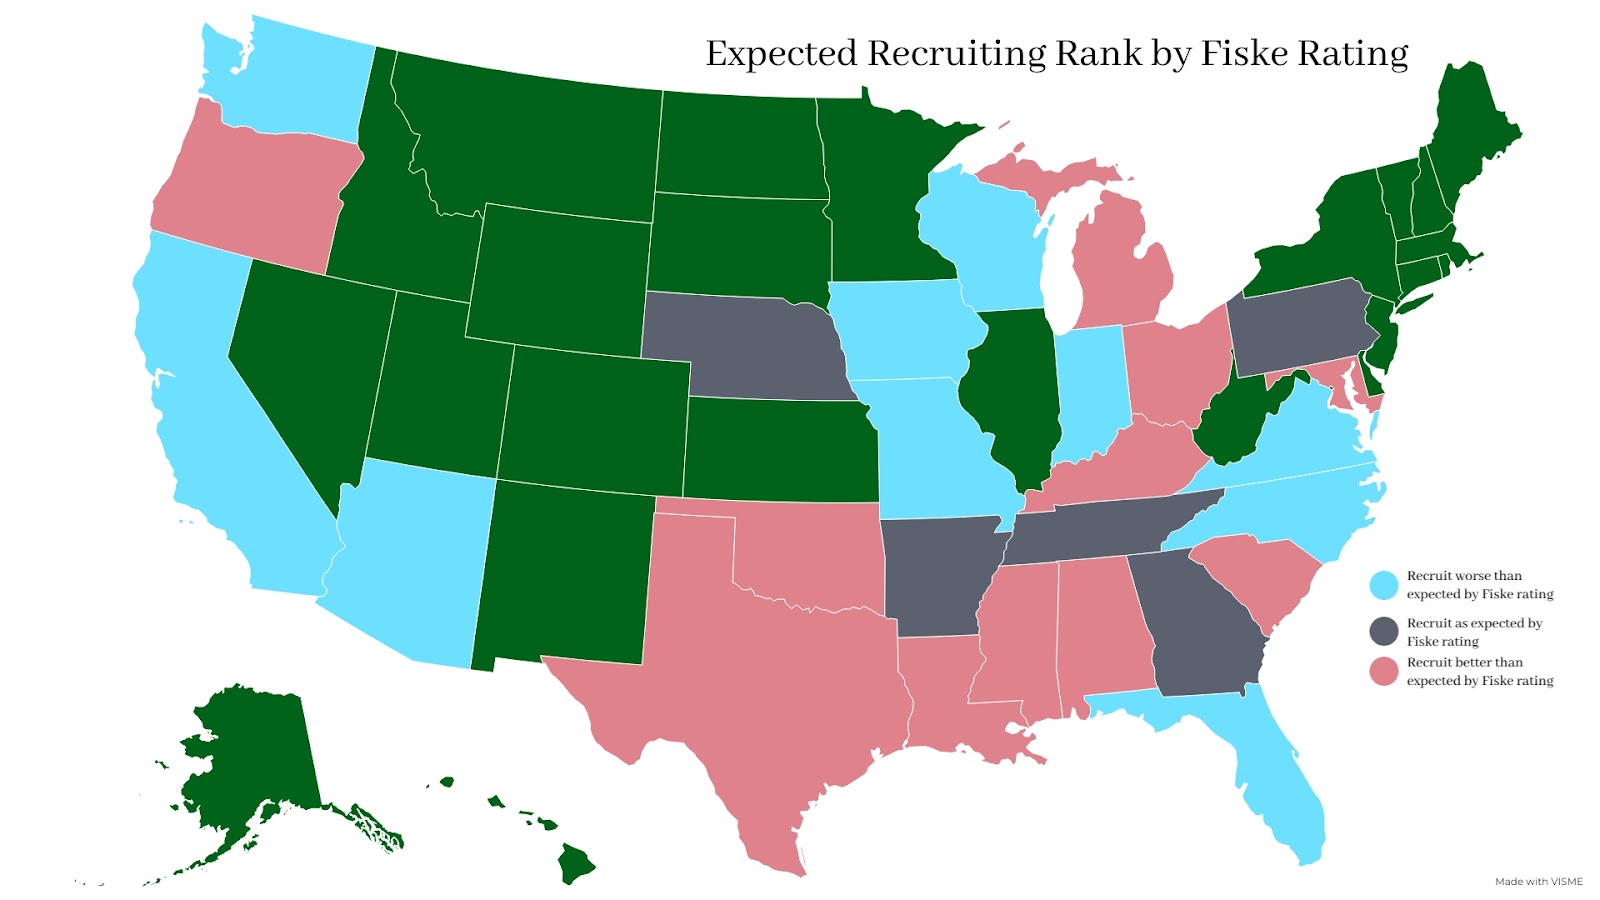
The following map represents the expected recruiting rank based on Fiske rating. States represented in blue recruit worse than predicted by just Fiske rating, states in dark gray recruit as expected by Fiske rating, and states in pink recruit better than expected by Fiske rating. These decisions are based on the categorical data presented in the previous two maps.
Another demonstration of this information is presented below. However, the graph below looks at this data with more precision. The quadrants are divided by the mean Fiske Guide rating and the mean average recruiting class rank from 2018-2022. In this breakdown, the 38 schools considered were also broken into five geographic regions: west, midwest, central, south, and southeast, represented by blue, green, orange, red, and black, respectively.
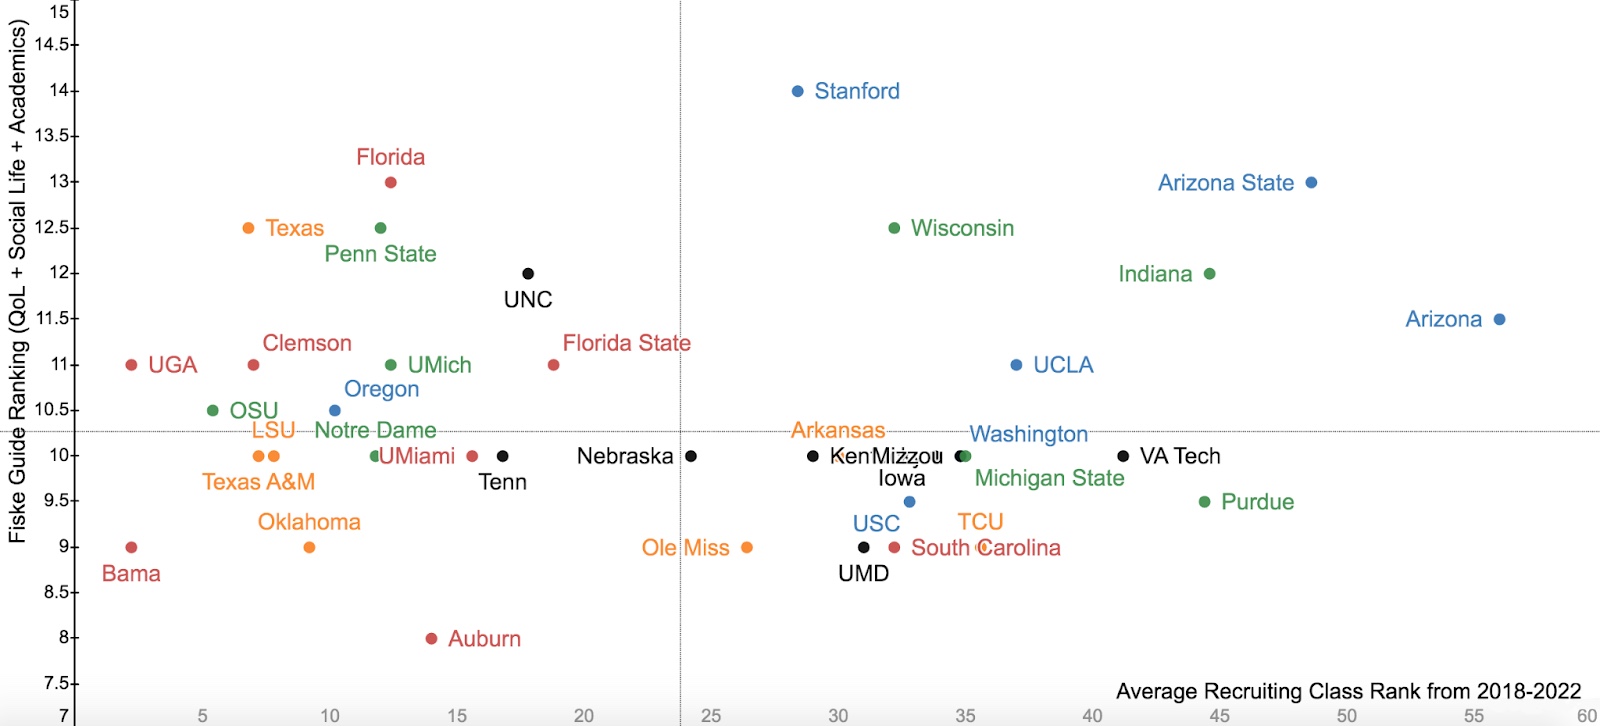
The map below helps visualize the geographic categories color coded in this graph.
 Top Left Quadrant: University of Georgia, University of Florida, Clemson University, Florida State University, University of Texas - Austin, Penn State University, University of Michigan, The Ohio State University, University of Oregon, University of North Carolina - Chapel Hill
Schools in the top left corner have high Fiske Guide ratings and highly ranked recruiting classes. This suggests that both the football program itself and the school’s lifestyle ratings are enough of a draw to produce a successful program. This also suggests that in off years, the school may be better equipped to still recruit well.
Top Right Quadrant: Stanford University, Arizona State University, University of Wisconsin - Madison, Indiana University - Bloomington, University of Arizona, UCLASchools in the top right quadrant have the lifestyle ratings to be attractive, but do not recruit as well as predicted by the Fiske Guide rating. This suggests that these football programs may not be strong enough to attract talented recruits, because based on school ranks, the lifestyle draw should be enough to recruit a solid class. This might lead to future recruiting efforts for these schools to emphasize lifestyle and benefits about their school over their football program.
Bottom Left Quadrant: Louisiana State University, Texas A&M, University of Notre Dame, University of Miami, University of Tennessee, Auburn University, University of Oklahoma, University of AlabamaSchools in the bottom left quadrant prove that football is a big enough draw because the program recruits better than expected based on the school’s lifestyle ratings. One can hypothesize that these schools are able to recruit because of the promise of successful football. However, it is possible that these schools’ future recruiting classes may suffer as a result of poor performance by the team because they do not have the lifestyle rating to back them up.
Bottom Right Quadrant: University of Nebraska, University of Kentucky, University of Missouri, University of Iowa, University of Maryland, Virginia Tech University, University of Arkansas, University of Washington, Purdue University, University of South Carolina, University of Mississippi, Michigan State University, Texas Christian University, University of Southern CaliforniaSchools represented in the bottom right quadrant do not recruit as well as the other schools in this set, but also do not have the highest lifestyle rating. This suggests that the team nor the lifestyle ratings have significant influence on an athlete picking one of these schools.
Focusing on the bottom left quadrant (recruiting better than expected) and the top right quadrant (recruiting worse than expected), there are some apparent geographic trends. The schools in the quadrant that recruits worse than predicted by Fiske rating are all in the west and midwest geographic divisions. The majority of schools in the quadrants that recruit better than predicted by Fiske rating are in the south and southeast geographic divisions. There may be many hypotheses concerning why this is the case – is football itself a bigger draw to the south while teams out west must recruit based on other deciding factors, including those listed in the Fiske Guide? These are all ideas to consider while watching prospective college football players on their recruitment journeys, and they may start to shift recruiting approaches for colleges.
*Although Mississippi State University has been ranked in the top 25 recruiting classes, it is not represented in the Fiske Guide ratings, so any data collected on the state of Mississippi is only taking Ole Miss into consideration.