Clustering NBA and WNBA Players
By Nathan Mehta | March 24, 2023
Any attempt by an ESPN or Sportscenter account to post WNBA highlights is routinely met with meme comments concerning the lack of entertainment value. But there’s still a ball, a hoop, and players dedicating their lives to a mastery of skills on a basketball court.
This August was honestly the first time I’d watched the WNBA playoffs. I quickly developed a list of favorite players that had eye popping skill: Chelsea Gray, Kahleah Copper, Jewell Lloyd etc. Not only that, I found myself enjoying games of the Aces vs Storm series more than some of the NBA playoffs. Rather than watching Luka or Harden go matchup hunting for hours, I saw something with a more fluid feel to it – a lot more ball movement.
The two leagues obviously lend themselves to different game aesthetics, but in which ways exactly do the players of the WNBA and NBA approach the game differently? A quantification of the differences in WNBA and NBA playing styles allows for identification of which attributes contribute to success in the NBA vs WNBA. Use of K-means clustering to bundle groups of players across a plethora of statistics provides a method of categorizing players in both leagues.
Beginning with classifying across shooting stats, I clustered NBA players across two advanced metrics: Effective Field Goal % and True Shooting%. EFG% is an overall shooting efficiency statistic that gives three-pointers more value than two-pointers, and TS% is a scoring efficiency statistic that takes into account free-throw and field goal attempts. K-means clustering identifies pockets of players in these 2 dimensions that are distinct. However, how many pockets aka clusters should we seek to identify? If we ask for 20 clusters, it’s too fine grained; each group wouldn’t tell us much about how it differs from the next. If we have only 1 cluster, we have obtained no information on the types of shooters that exist in each league. Here’s where we make an inertia plot (plots the variance within clusters as we keep adding more of them) to deduce the optimum number of clusters:
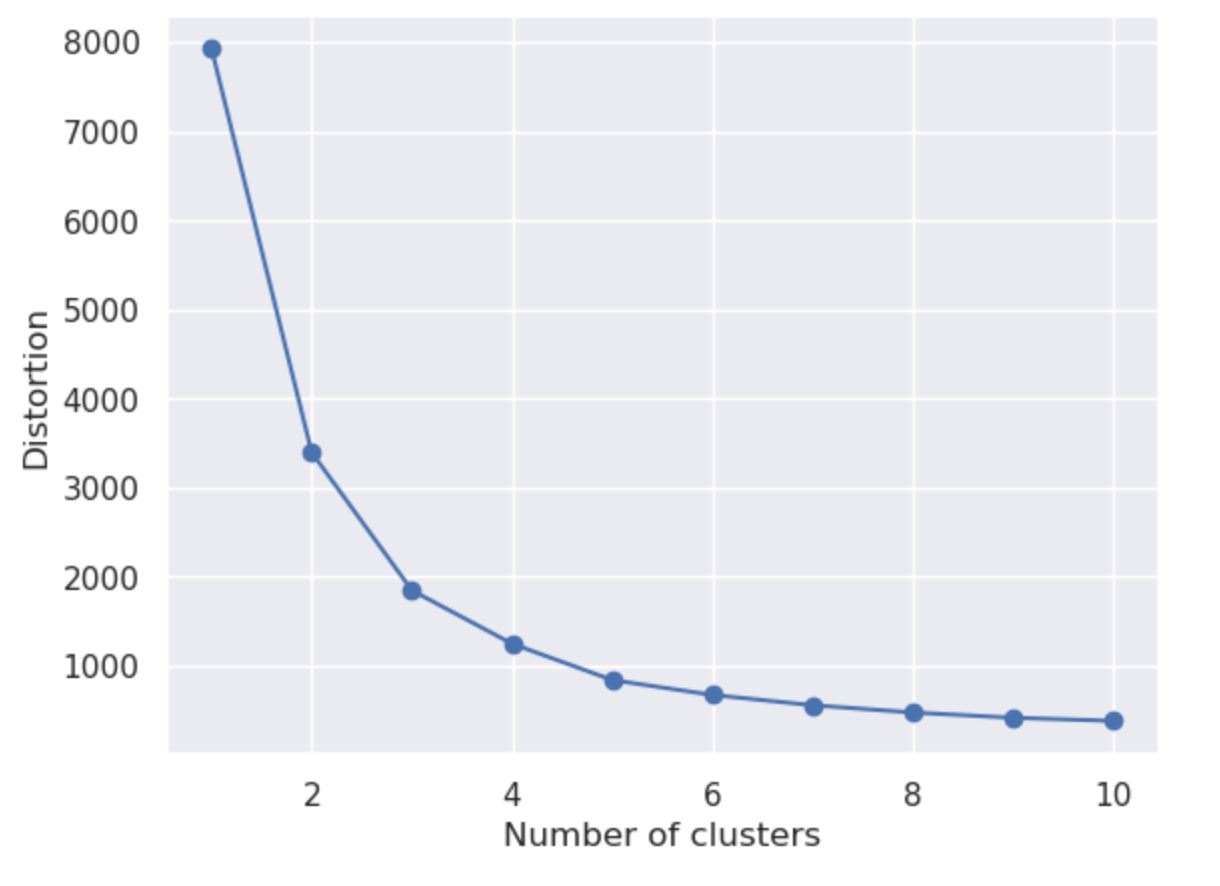
Here, the inertia plot indicates that we select 3 clusters. After 3, the rate of reduction in intra-cluster variance decreases considerably.
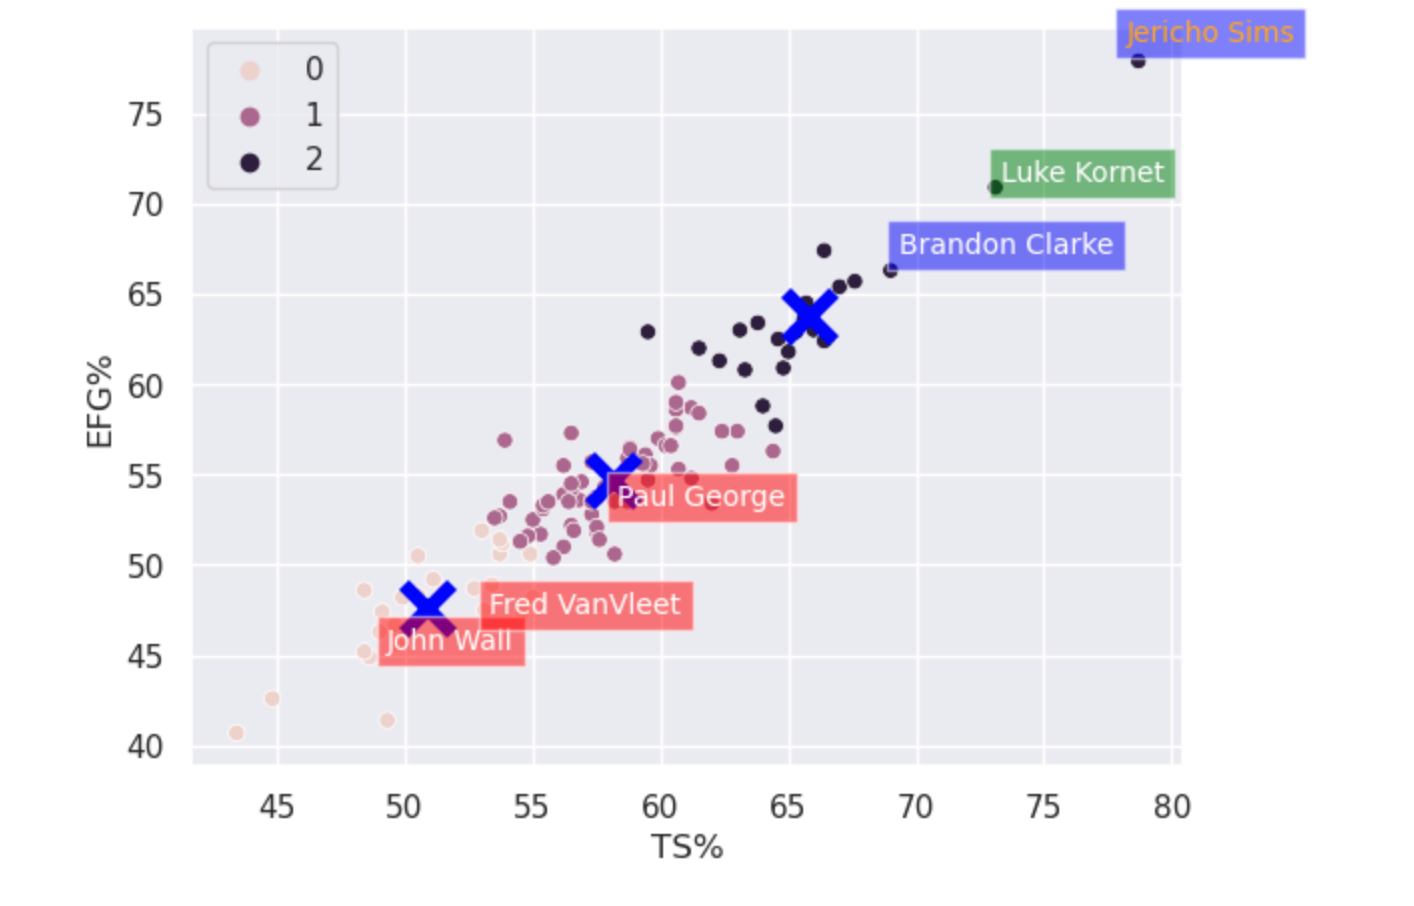
X’s represent cluster centers
What strikes you when examining the clusters of the shooting data for the NBA? For me, it’s that centers dominate shooting statistics, even stats like EFG and TS which take into account the value of three-pointers and free-throws. Luke Kornet, Brandon Clarke, and Jericho Sims, located in cluster 2, are not known as shooters, of course. Most of the shots they take are layups or dunks, skewing their efficiency statistics. Meanwhile, star guards like Paul George and Fred VanVleet fall into the middle (1) and lower (0) clusters, demonstrating that the players with more value to their team are poorly represented by these advanced shooting stats.
Now let us identify clusters of shooters for the WNBA.
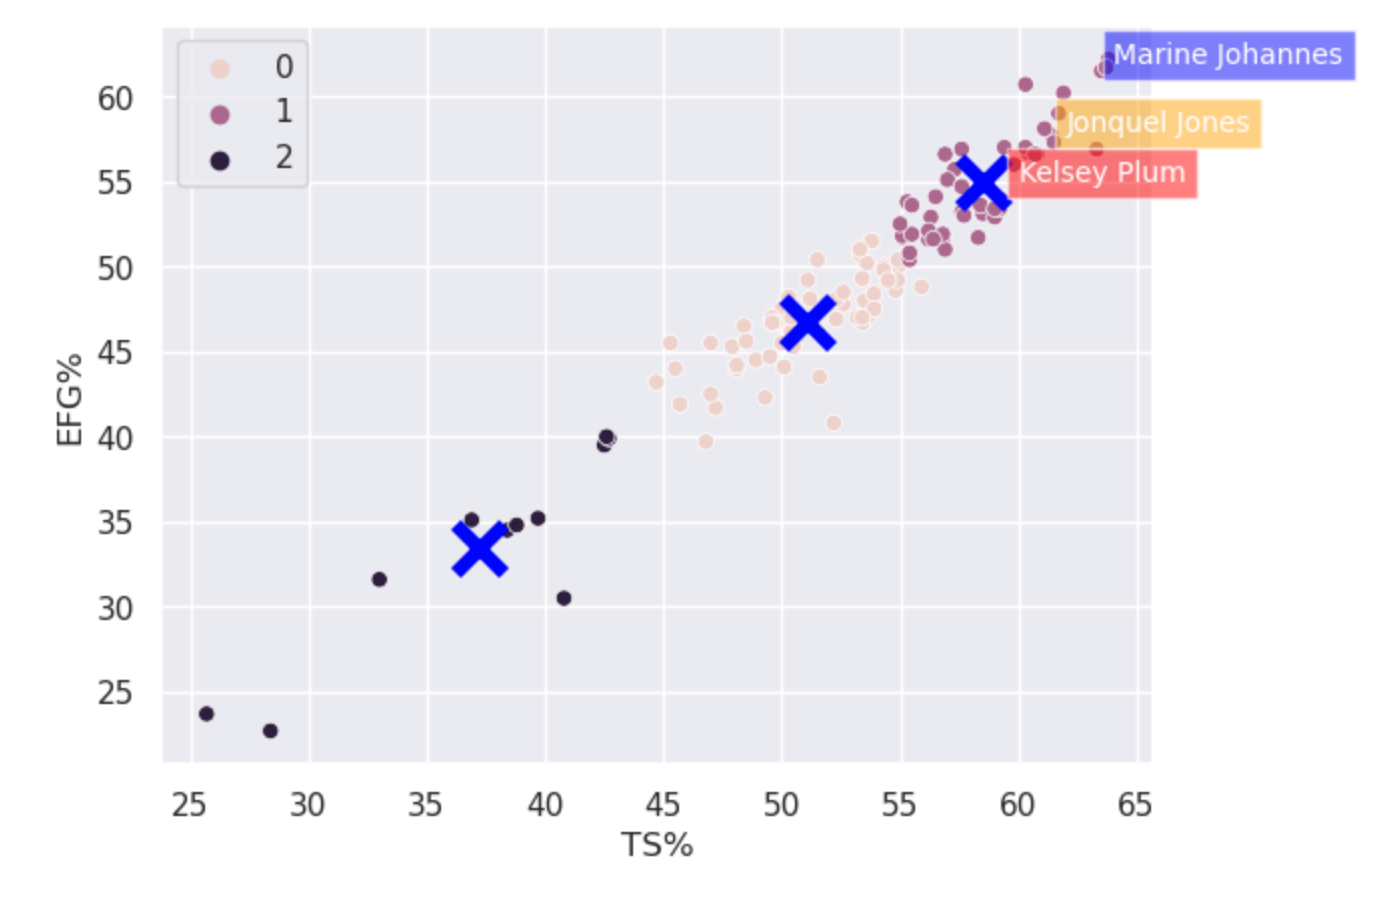
The upper cluster of WNBA players features big names of the game. Kelsey Plum was second in scoring average, and first in 3PM in 2022 with 20.2 PPG. She was an All-Star and key contributor to a championship team. Johannes was top 10 in 3P% and 3PM, while Jonquel Jones was WNBA MVP in 2021. The lower clusters of the WNBA shooting matrix are populated with less valuable contributors.
Kelsey Plum and Marine Johannes fall into a vastly different player profile than Luke Kornet or Jericho Sims: they are more valuable and better 3-point shooters. The WNBA shooting efficiency clusters seem to correlate much stronger than those of the NBA to value on the court, and why is that? I believe the answer lies in the same reasoning that pulled me towards watching the women’s style of basketball predicated on ball movement and quality shot selection.
To expand on this, I needed to dig into the causes of the discrepancy in player profile between high-clustered NBA and high-clustered WNBA players. I investigated the usage rates (approximately how much of the offensive output a player is responsible for on their team), across clusters. In the NBA shooting matrix, the upper cluster of players averaged a usage rate of ~14% while the upper cluster of the WNBA averaged 6 percentage points higher at 20%. The lower cluster of the NBA sits at ~17% while the lower WNBA is 16%. So, as you move from cluster 0 to cluster 2 in the WNBA, usage increases by an average of 4 percentage points, while the opposite happens in the NBA!!
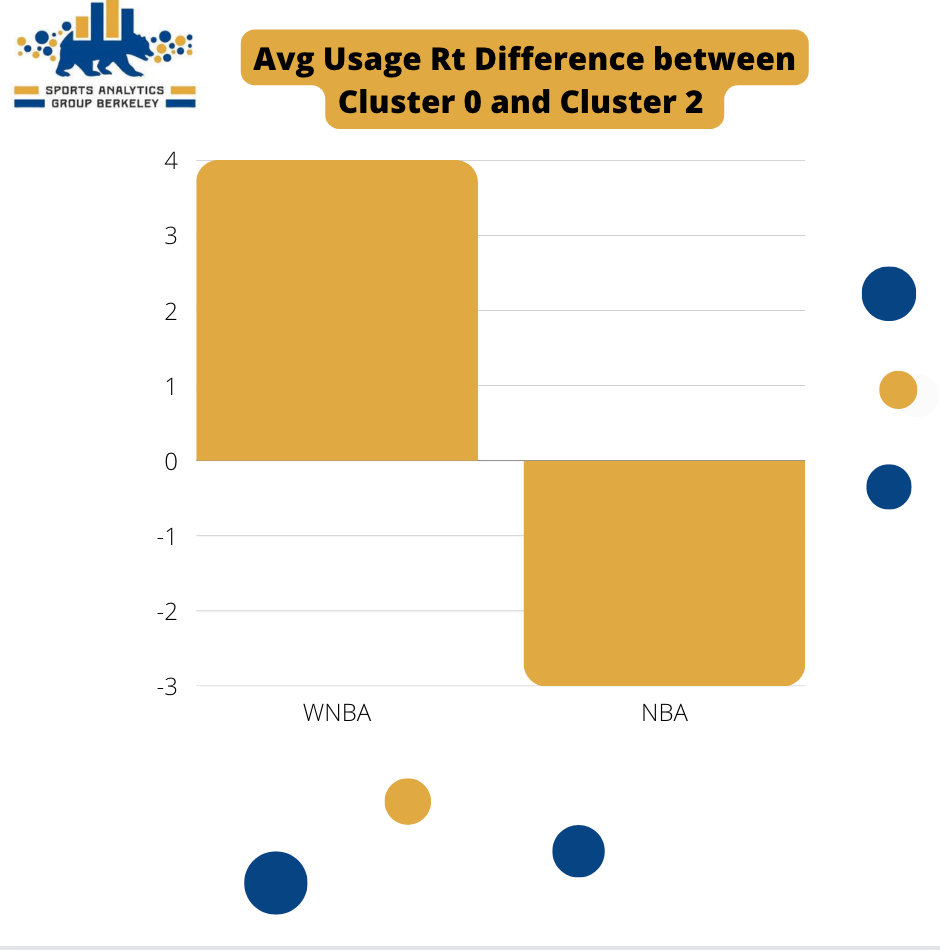
Confirming intuition, the conventional playing style of the WNBA involves the most important, high usage players taking more quality shots.
The appeal of the NBA is also its downfall, in the sense that much of team strategy is giving the ball to the best player, and letting them ‘cook’. This makes for a more marketable product, as fans get attached to ‘The Greek Freak’ and ‘Luka Magic’, but results in interesting findings when you try to identify the exceptional players through statistical methods as above.
Another possible factor contributing to this discrepancy across the two leagues is the height of the basket. Of course, the average WNBA player’s height is considerably lesser than the average NBA player’s height. The average WNBA height hovers around 6 feet while the average height for an NBA player in 2022 was 6 foot 6. However, the height of the basket is constant across leagues: both play on a 10 foot tall hoop. Given this fact, it also makes sense that height has less of an impact on shooting efficiency in the WNBA than it does in the NBA, where the tallest players approach eye level with the basket. Perhaps, even with all the talk of lowering the WNBA rim to allow for more dunking, the WNBA game format isn’t the problem. Maybe the NBA rim should be heightened, to allow for the best shooters to be better represented by EFG and TS.
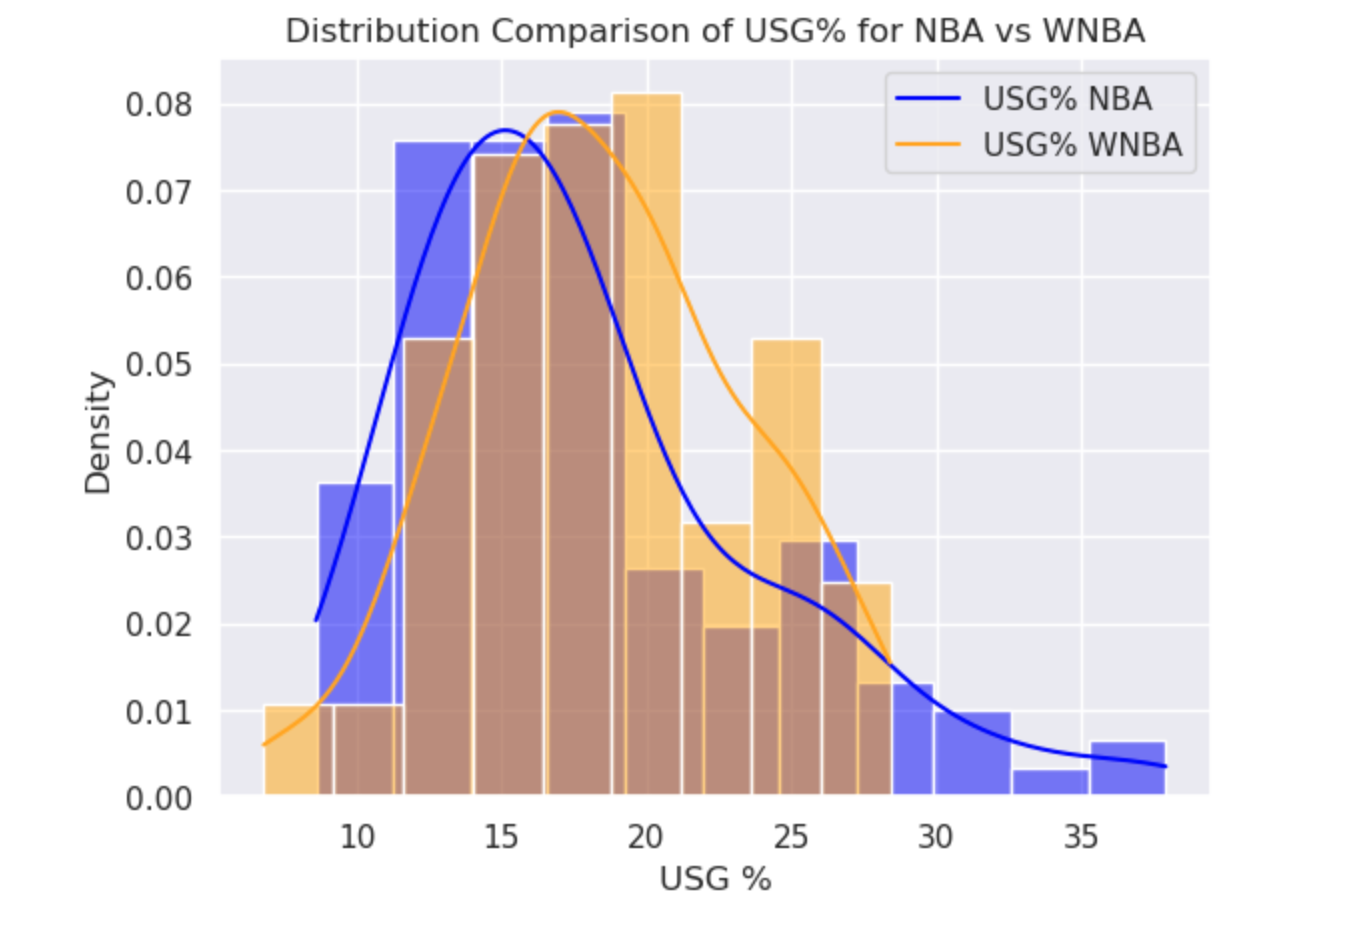
The blue curve above, demonstrating the distribution of NBA usage rate, shows a glaring tail on the high end of usage, where there is no orange in sight. This portrays the outliers in usage in the NBA that are not present in the WNBA. The preeminently talented players in the NBA hijack the usage on their teams in a way not seen in the WNBA, resulting in the difference in the pockets of shooters we identified for each league. The WNBA (orange) curve shows a much more even division of usage across their players.
Of course, the NBA stars we are talking about are the most talented basketball players in the world. (Luka, Kyrie, Dame, etc.) This analysis is not to tarnish them but to show how the style of play results in different interpretations of shooting stats for the NBA vs WNBA. When usage goes up, of course it’s understandable for efficiency to take a hit. The numbers of these high output players are still amazing given their workload. However, it’s interesting to consider whether the conventional WNBA playing style has advantages.
Let’s zoom in on Usage vs EFG to gain some more insight:
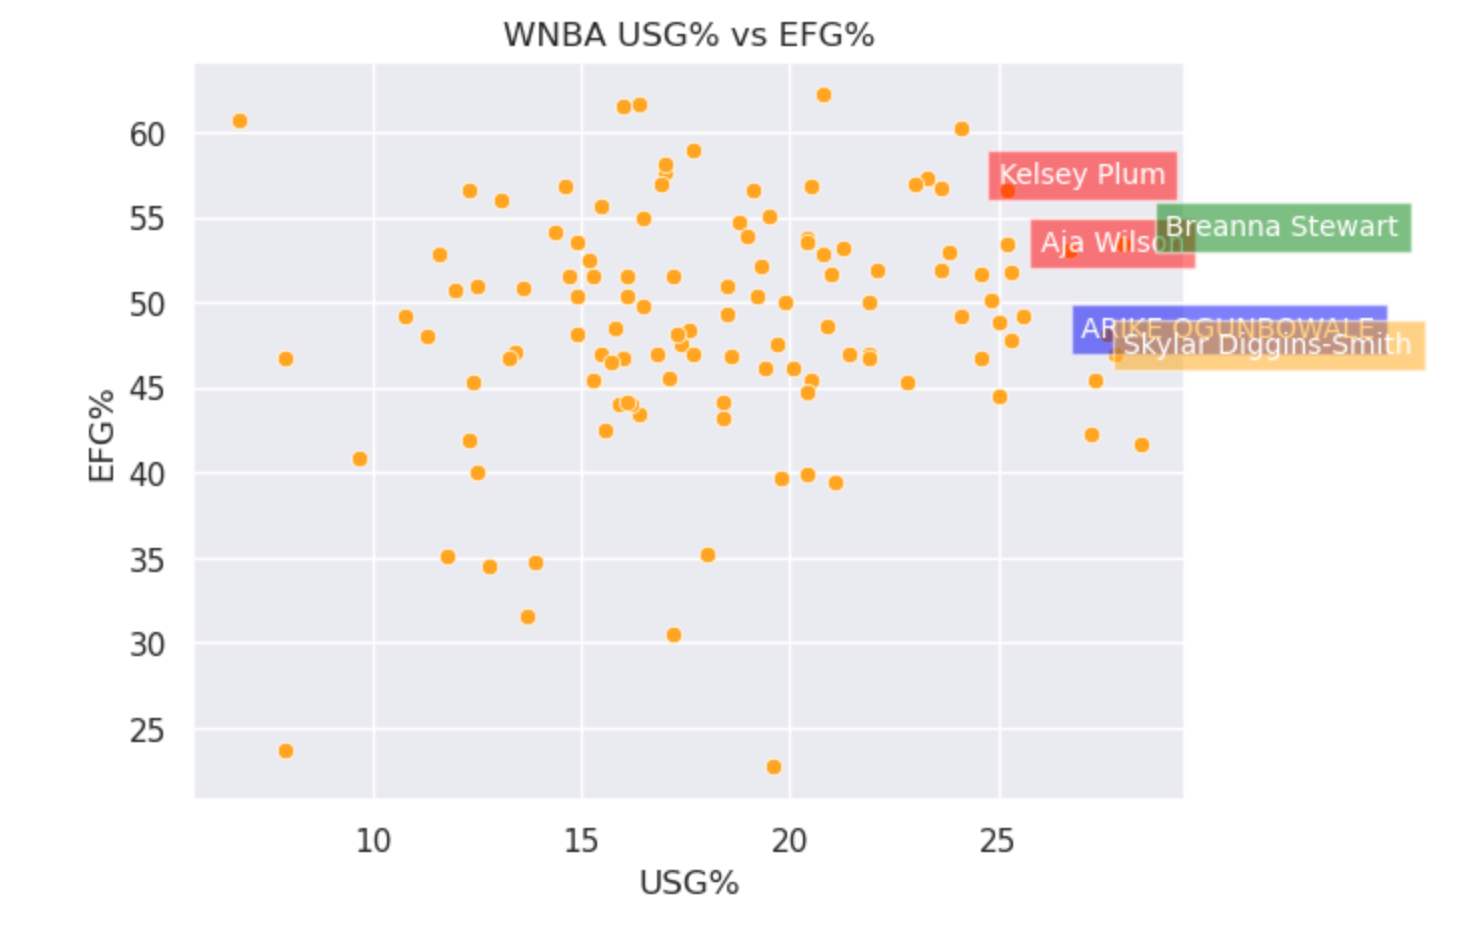
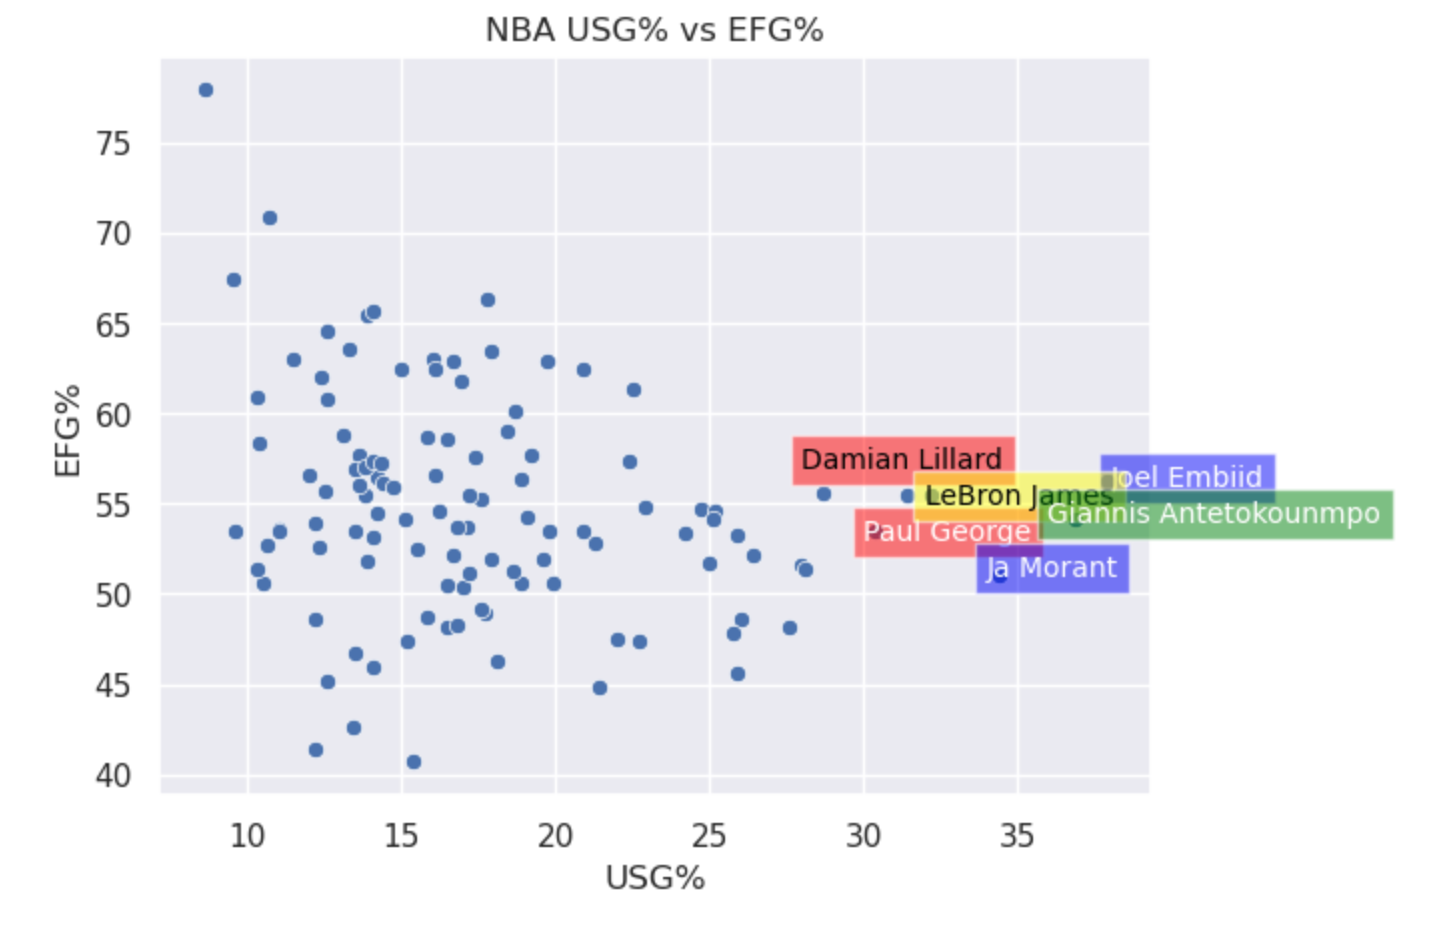
We can see that the plots have almost an inverted shape! The WNBA’s relationship between EFG and USG is almost the opposite of that in the NBA. Overall, as usage goes up, efficiency goes up in the WNBA. Meanwhile, the opposite happens in the NBA. The NBA scatterplot shows a sort of inverse relation between EFG and USG, but the star players at the tail end of USG buck the downward trend. The graph tends to move down as we get into higher usage, but then stabilizes around 55 EFG% for the superstar players. This confirms suspicions that even though the best NBA players aren’t necessarily represented the best by advanced shooting stats, they perform well given their workload.
In conclusion, both of these leagues play basketball, but in very different styles. The NBA revolves around individuals that control every possession for their teams. On the contrary, WNBA stars are much more integrated into an overall offensive scheme.
*data from first 40 games of 2022 NBA season and the full 2022 WNBA season