Fool's Gold? How Much Does Gold-Glove Defense Really Influence a Win?
By Gordon Liang | June 4, 2022
It’s no secret that, in baseball, defense isn’t as valuable as offense is. Unlike in other sports where defense can set you up to score (a steal leading to a fastbreak in basketball) or even score points for you (a pick six in football), what you do on defense in baseball doesn’t change the fact that you’re starting your half of the inning with the bases cleared and no outs. Sure, defense can prevent runs but it won't help you score runs. There’s a reason why Andrelton Simmons, who has the second-most career Defensive Runs Saved (DRS) since the statistic’s introduction, signed only a four-million dollar deal this offseason whereas Corey Seager, who has a career negative-six DRS but a career 132 weighted runs created plus (wRC+), signed a $325-million contract over ten years.
But when building a winning roster where do we draw the line between the two? And where does pitching fit into all this? Yadier Molina, in the eyes of the general public, is a lock for the Hall of Fame but– like Simmons– his offense holistically has been sub–average over the course of his career. The Phillies took an extreme approach this offseason. After having the lowest team DRS in 2021, they signed Kyle Schwarber and Nick Castellanos: both of whom posted a wRC+ of 140 or higher but a DRS of negative-five and below. By neglecting defense altogether the Phillies pose a question for General Managers of the future to ponder: Can a baseball team succeed completely independent of a whole facet of the sport?
Disclaimers
Before we delve into the findings, it’s important to consider a few points. Correlation isn’t causation. The adage applies to baseball as much as it applies everywhere else. The sport is random and metrics won’t account for it. On the contrary, they attempt to remove it for the sake of finding a player’s intrinsic value. The best team doesn’t always win (take the 2019 World Series for example) and the better performance doesn’t always result in the win (take the Pirates’ recent win against the Reds without recording a hit for example). The game, for the most part, remains the same today as it was in 2015 yet we see huge changes in correlation values over the years.
2020 was skipped. In addition to not providing a large enough sample to draw any conclusions that year, some teams played less than the already-abridged 60 games that season.
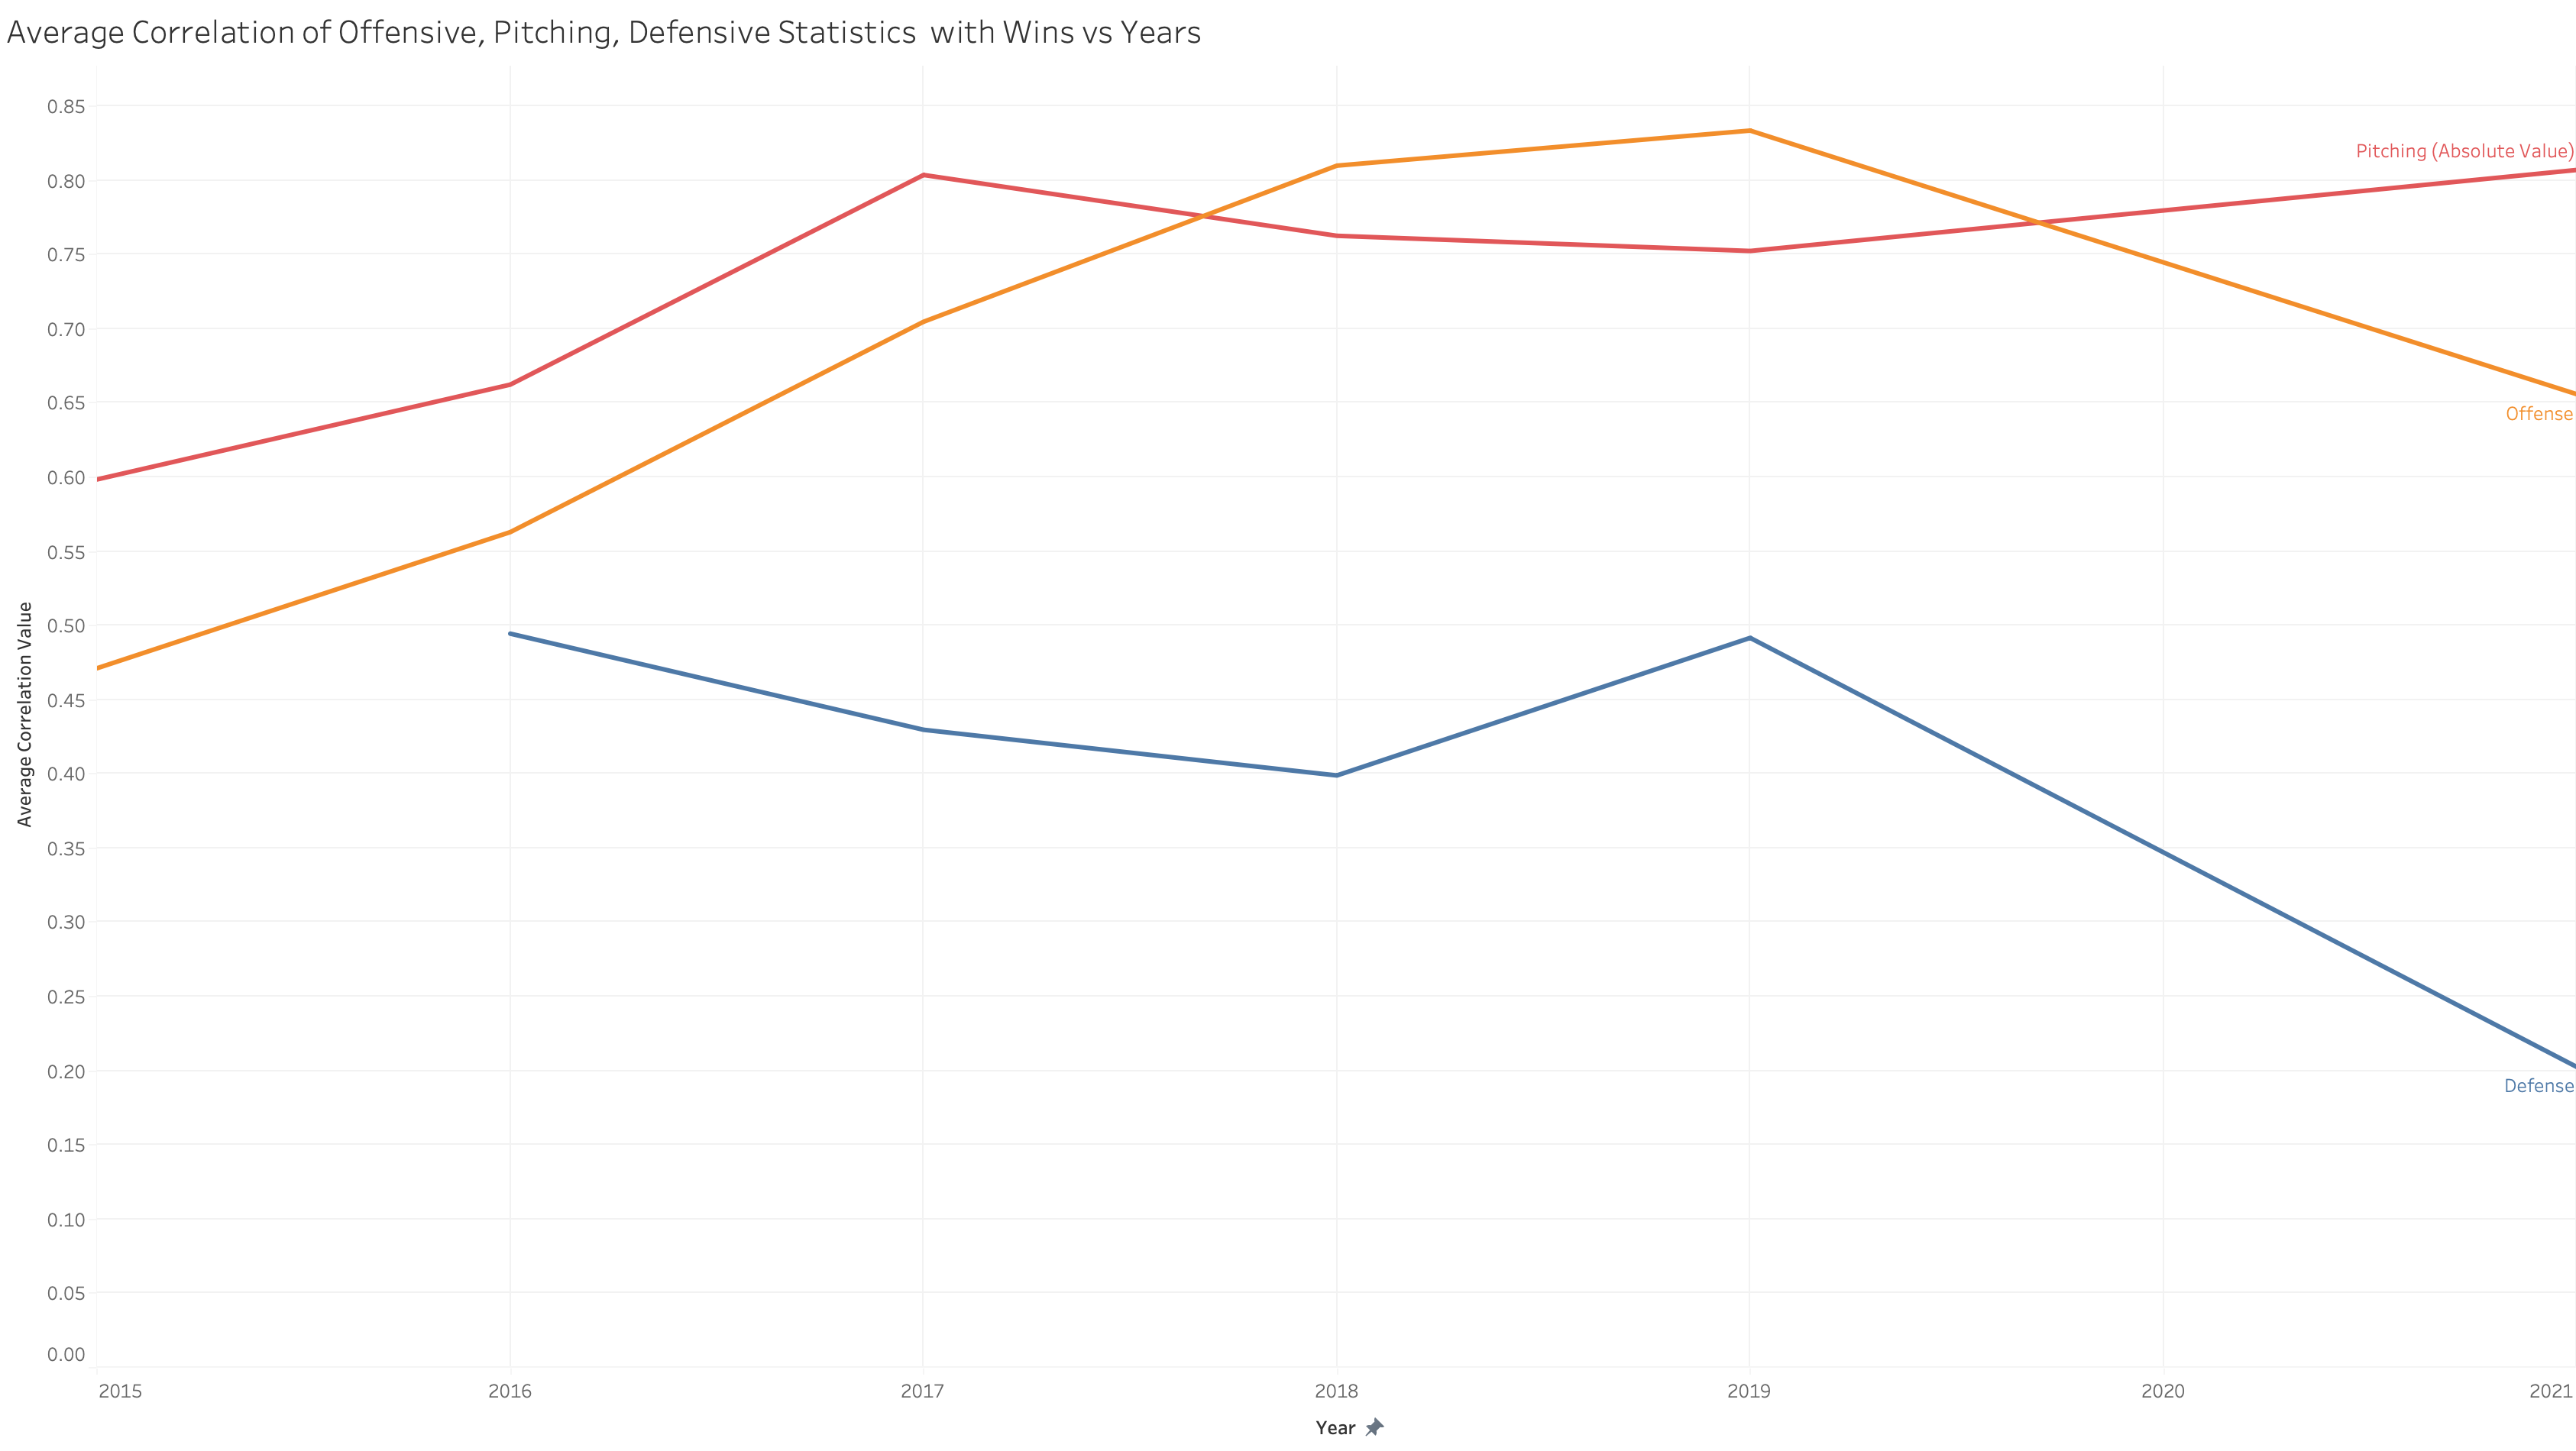
Because of the high discrepancy between OAA and DRS, the average between the two statistics as shown in the graph below won’t be very telling of the facet as a whole.
Pitching
There are three major advanced statistics for evaluating pitching: Fielding-Independent Pitching (FIP), Skill-Interactive Earned Run Average (SIERA) and Expected Earned Run Average (xERA). Instead of xERA, Expected Weighted on-base Average (xwOBA) is used because the two statistics are 1:1 conversions of each other. These three statistics attempt to isolate pitching ability from fielding. By using them instead of simple Earned Run Average (ERA), our idea of the influence of pitching isn’t as diluted by fielding ability. The graph below shows the correlation coefficient of how teams performed in each statistic to how they performed overall that season (how many wins they accumulated). The y-axis is inverted because a lower value in these statistics indicate better performance so by inverting, more correlation is still higher on the graph.
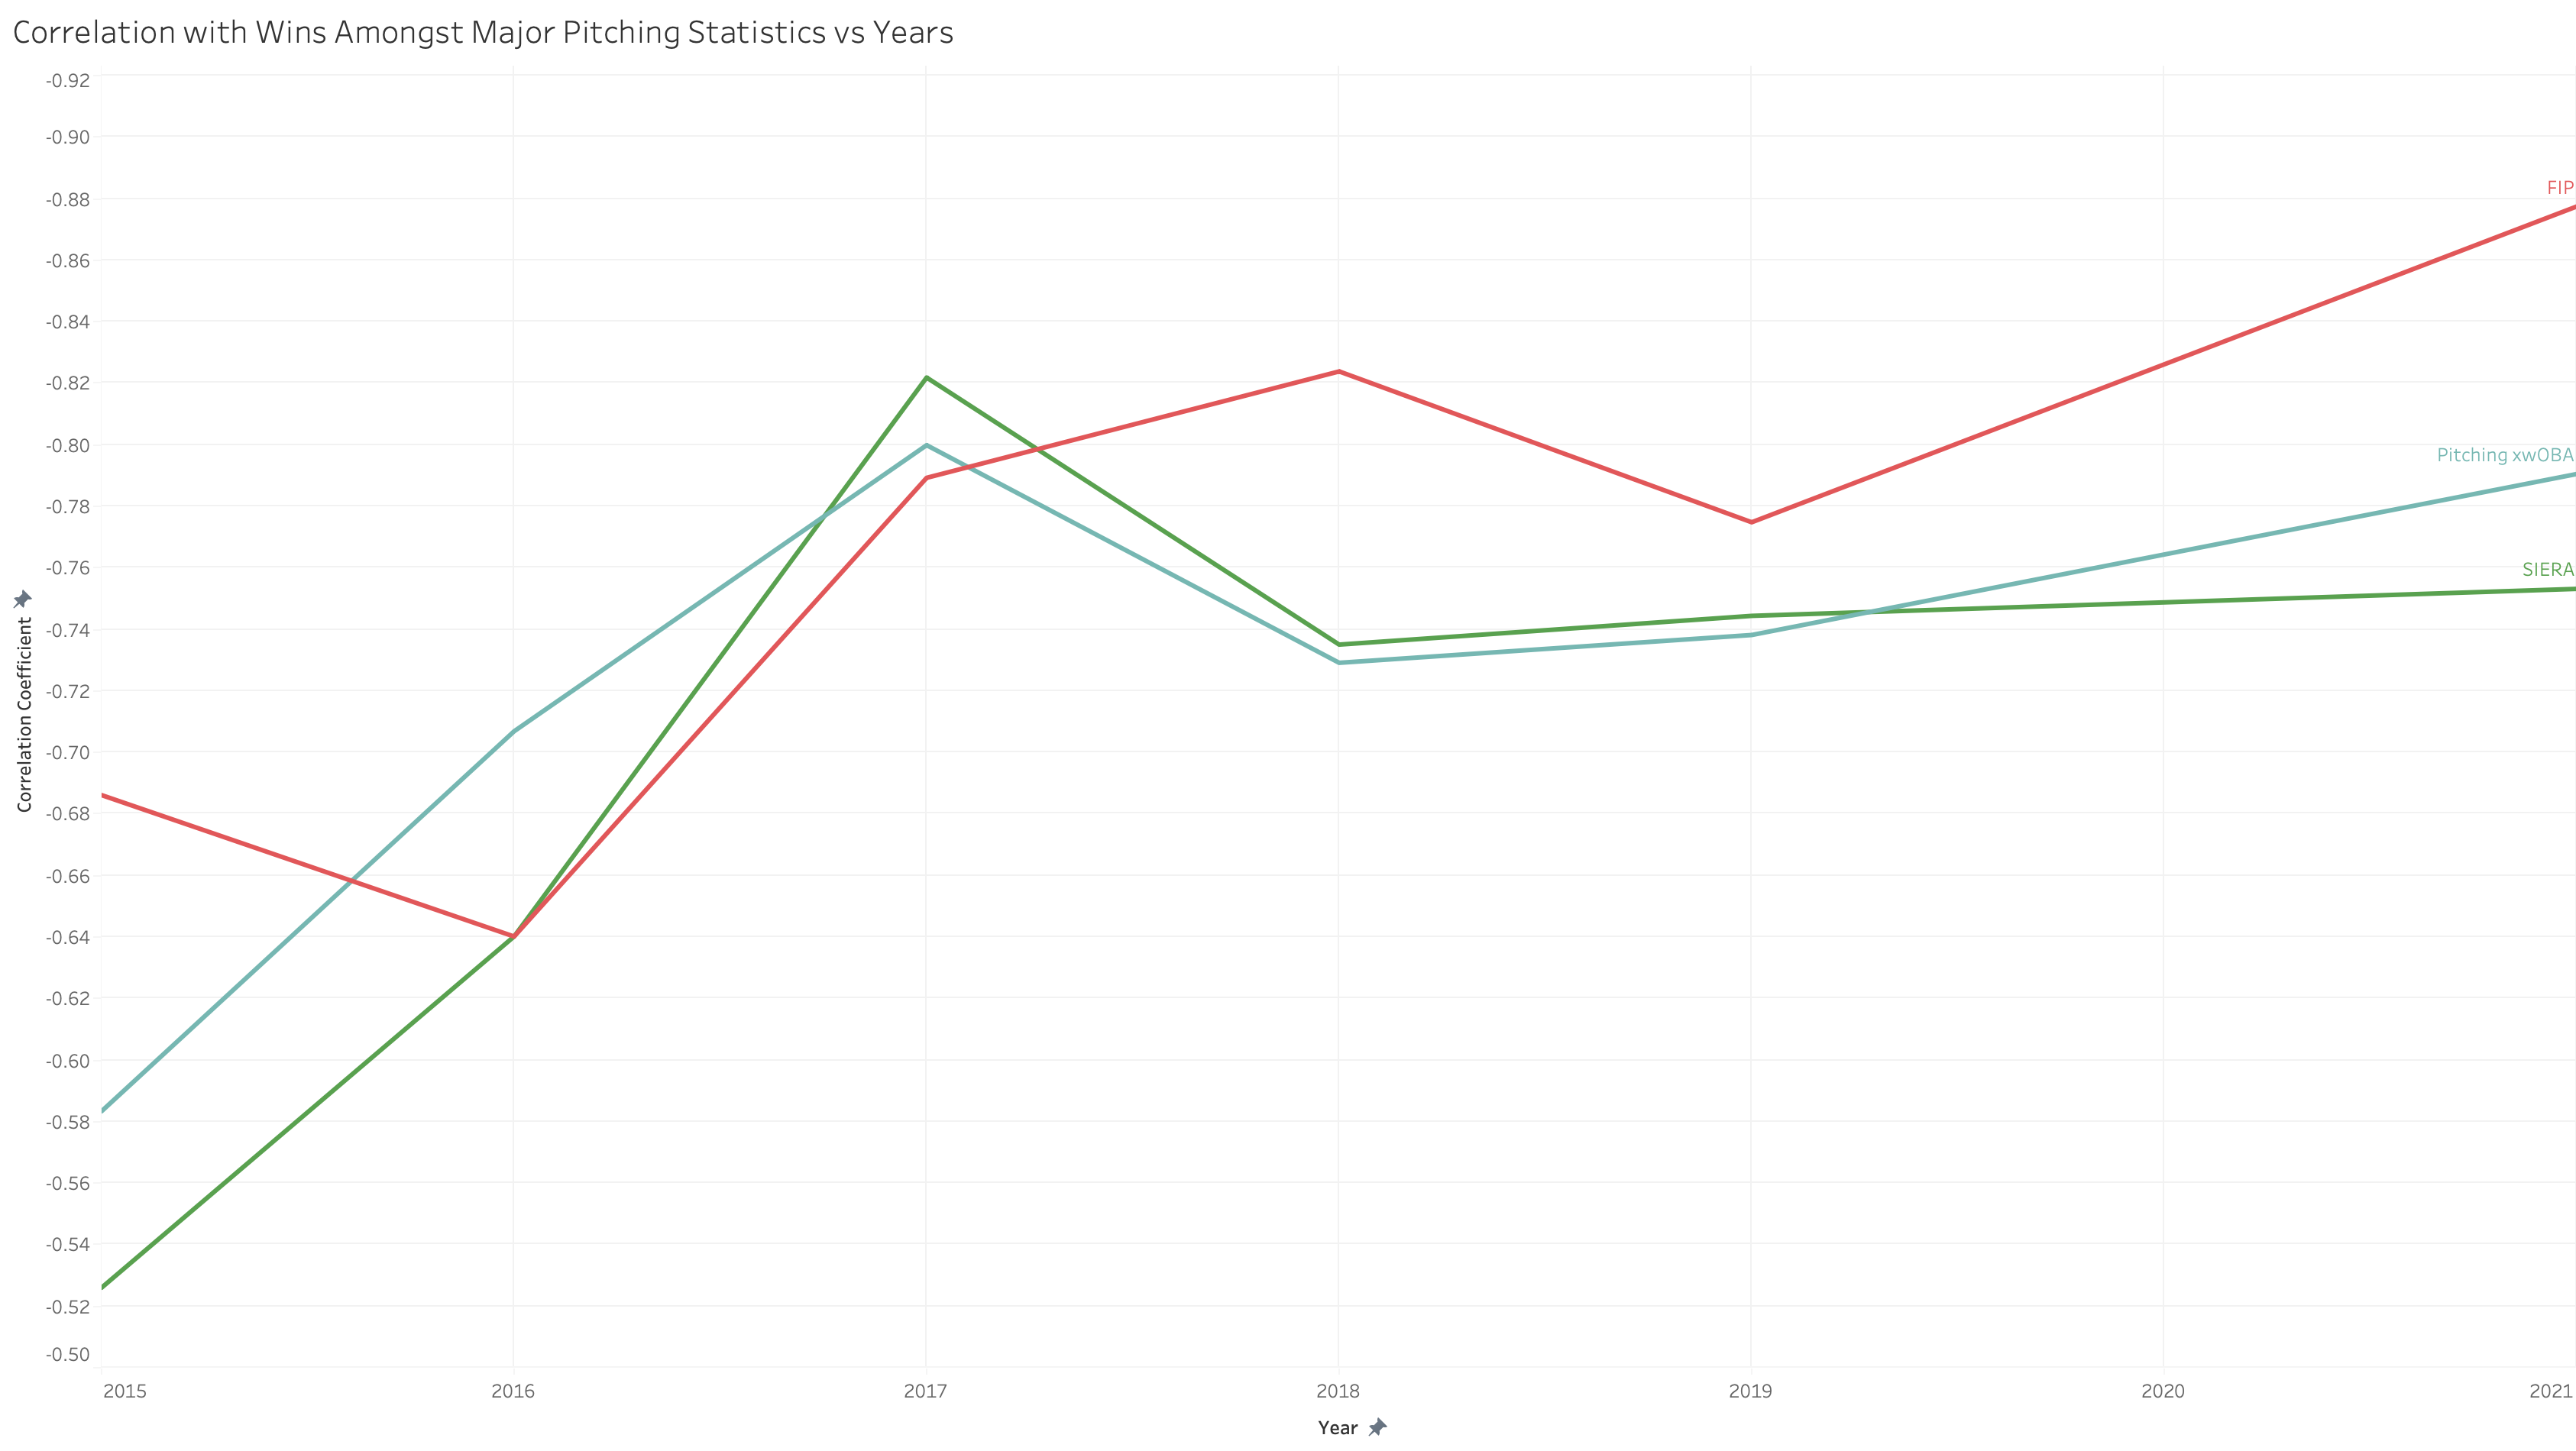
Though correlation changes over the years, we experience a fairly similar trend among the three statistics and in every year since 2015, pitching has consistently yielded high correlation with winning.
Offense
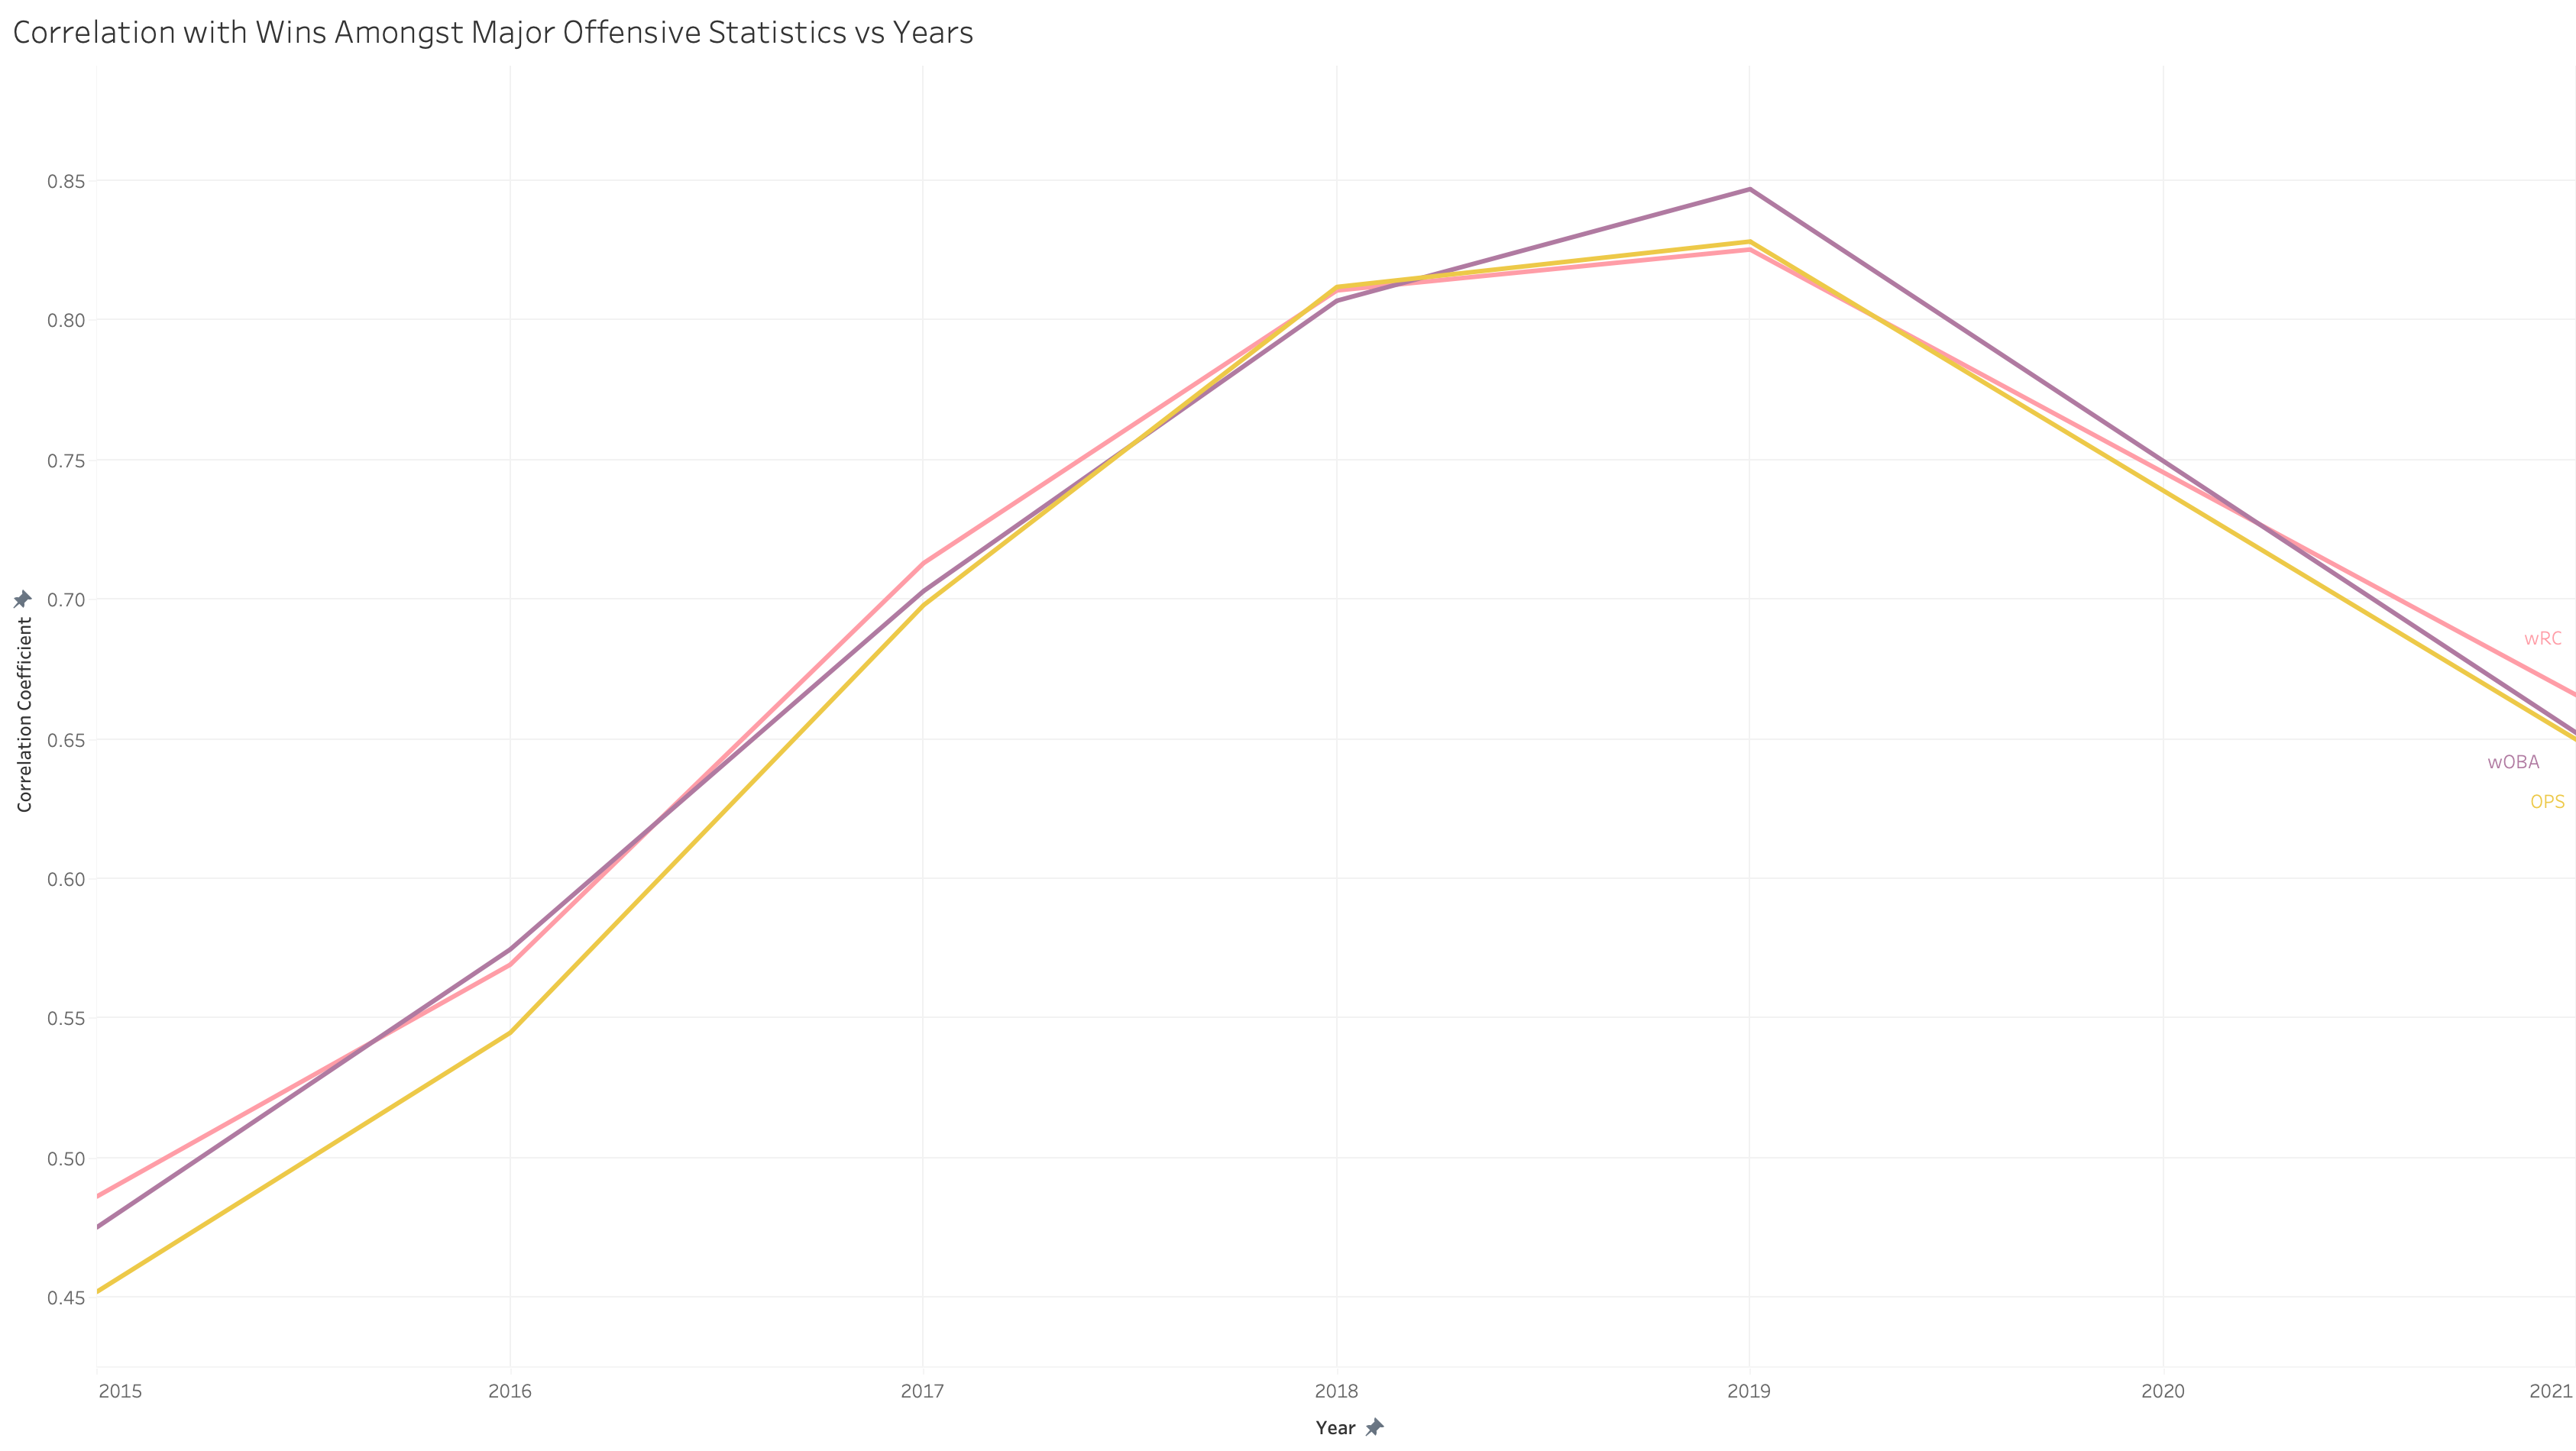
Similarly to pitching, offense can also be summarized using three main statistics: Weighted on-base Average (wOBA), Weighted Runs Created (wRC) and On-base Plus Slugging (OPS). The three statistics are nearly the same, which is why we see very similar trends in correlation, with some slight discrepancies. Just like with pitching, we observe a high correlation between offensive performances and wins and a high variation over the years.
Defense
When looking at the defensive side of the diamond, we find an unfamiliar picture. Unlike with pitching and offense, the trends and correlation values among the defensive statistics vary highly from each other. In addition to that, defense only has two major statistics as opposed to the three that were used for the other facets.
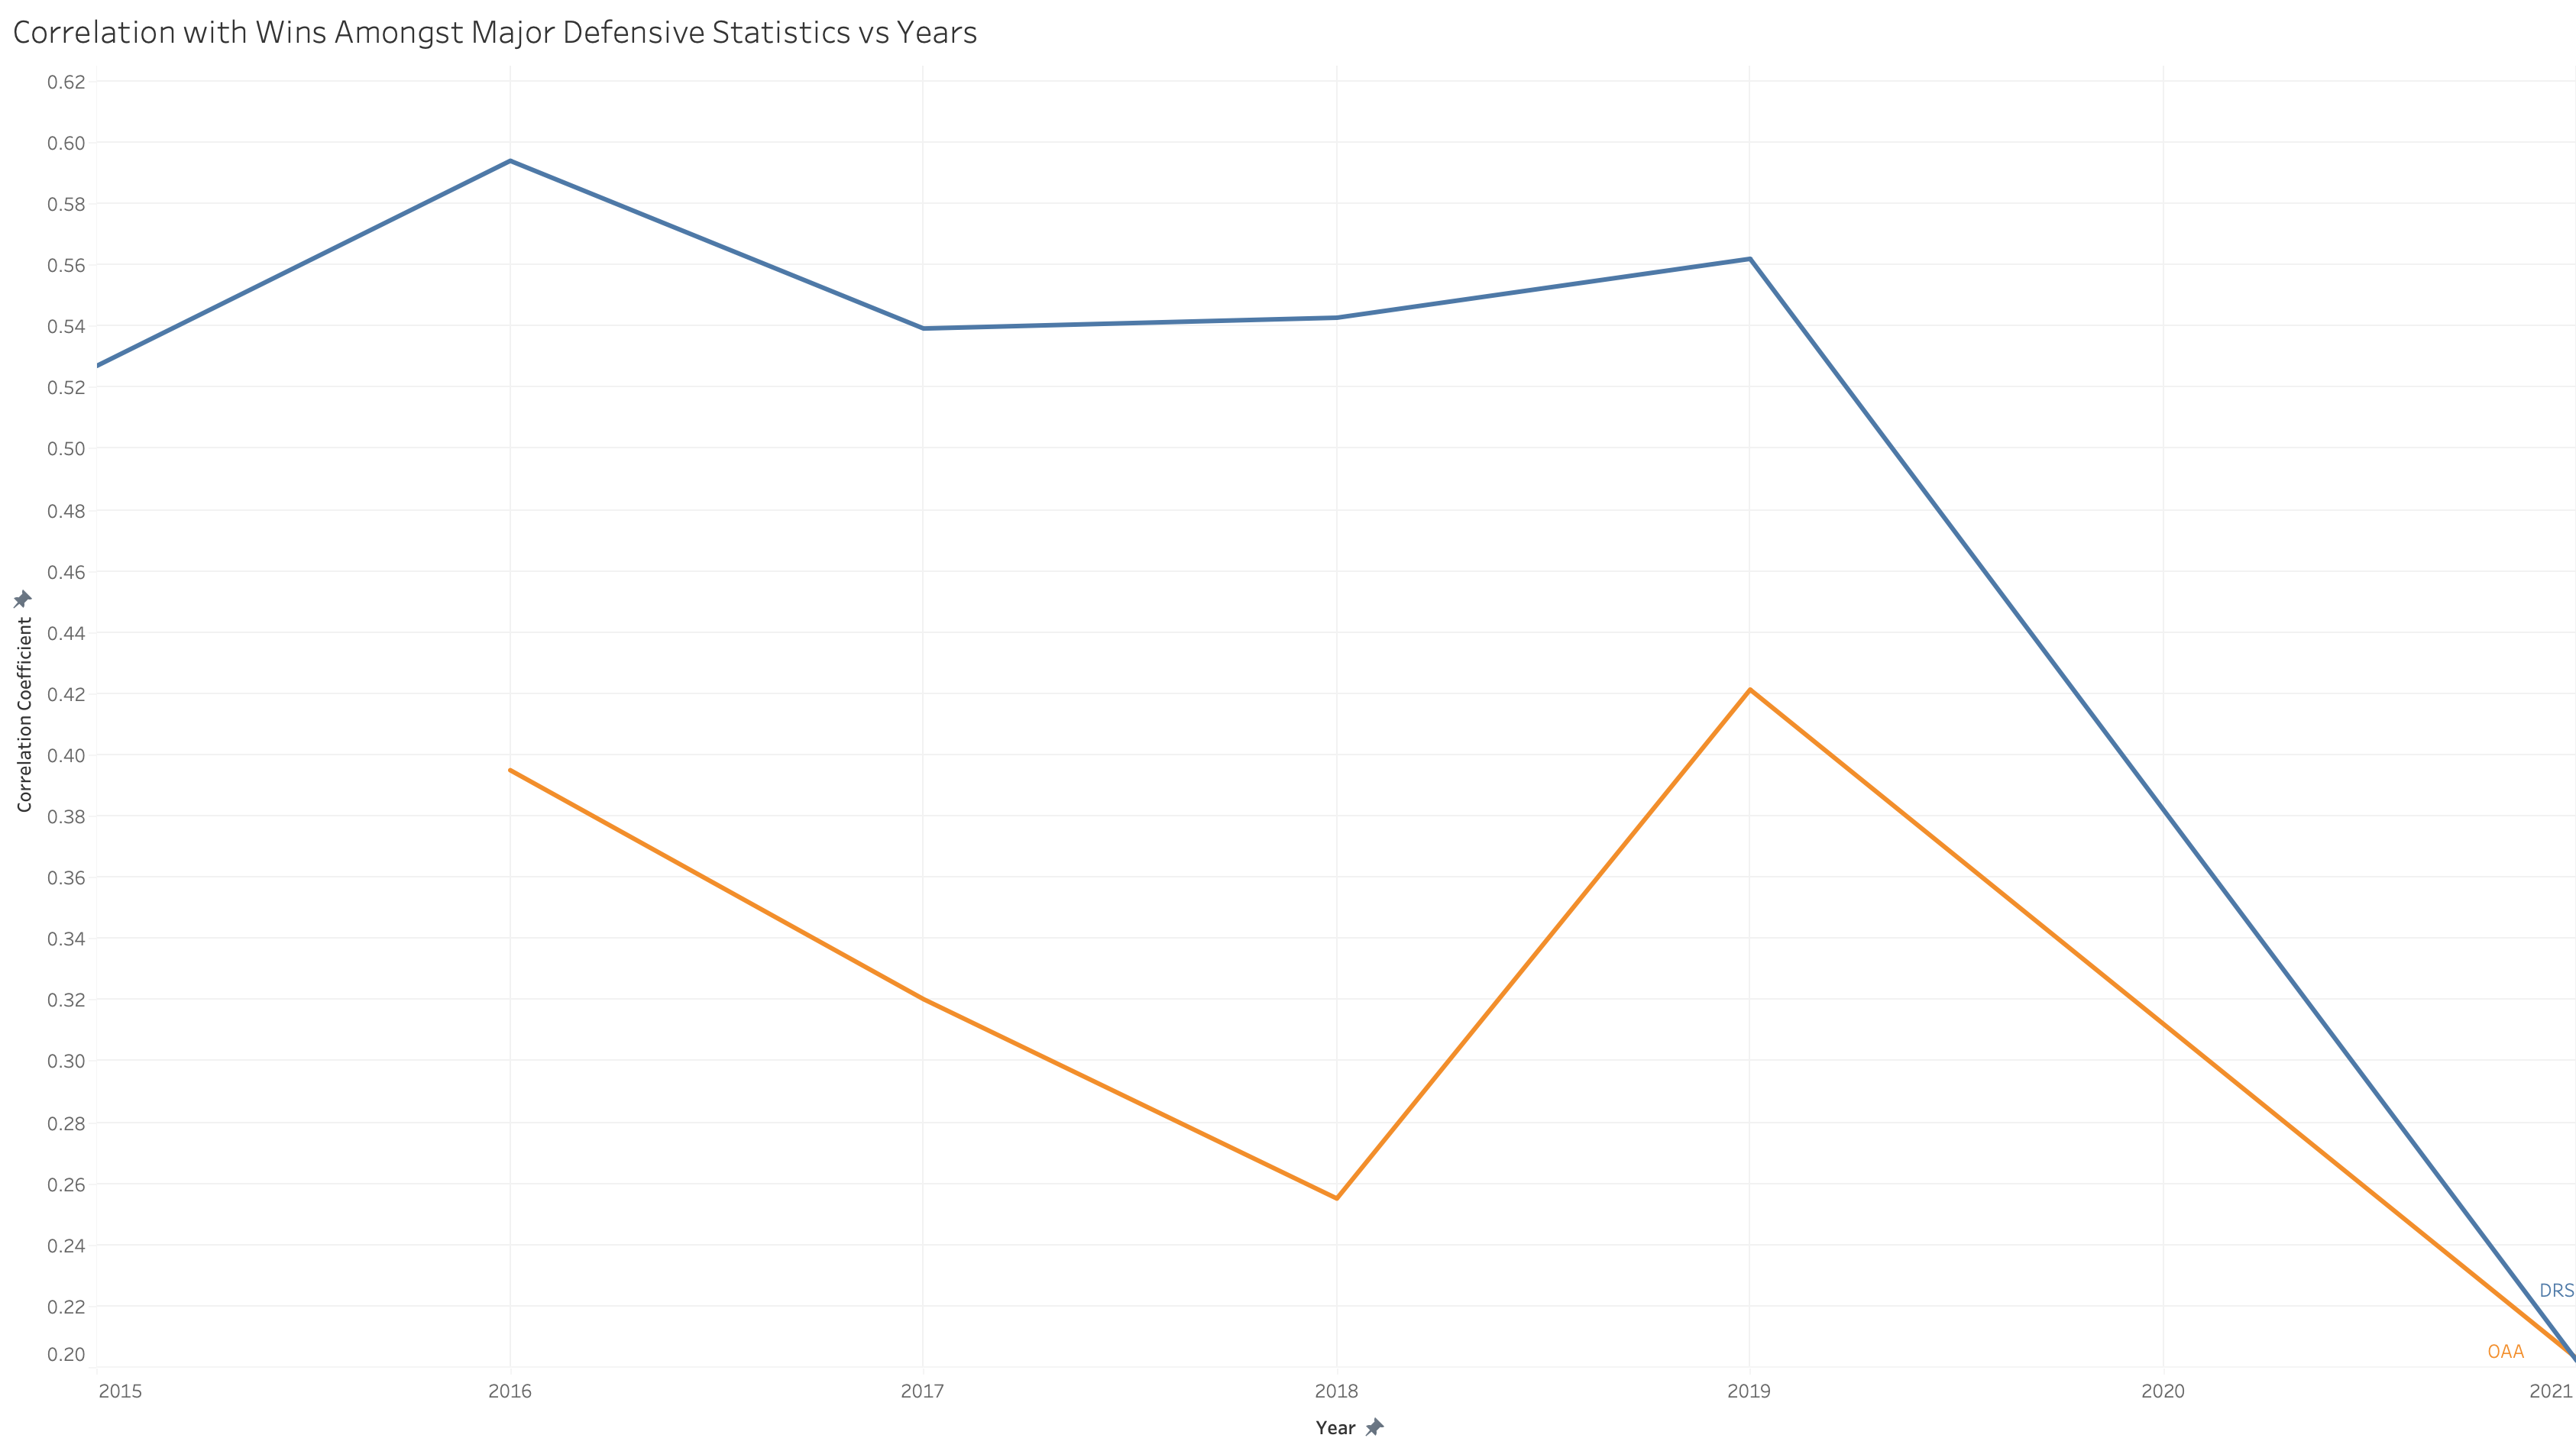
DRS has a much higher correlation in the early years than Outs Above Average (OAA), which was introduced in 2016. In some years, DRS even had a higher correlation to wins than the offensive statistics. On the other hand, OAA never came particularly close to competing with the other facets of baseball. This could be due to the fact that OAA is still a very new statistic or because it’s average-adjusted unlike DRS. Optimistically, last season suggested a more united depiction of how influential defense is as both statistics yielded very similar correlation values (DRS: 0.2023, OAA: 0.2031).
Takeaways
Despite having a significantly lower average correlation, defense is still severely underrated. Depending on whether one values DRS or OAA more, an argument can be made that it was actually more valuable than offense at some point. Up until last season, DRS consistently had a high correlation with wins. But regardless of which statistic you prefer, defense contributes a lot more to winning than the contracts are implying. Seager makes over eight times as much as Simmons and is under-contract for ten years for excelling in a facet that’s not even close to being eight times as influential.
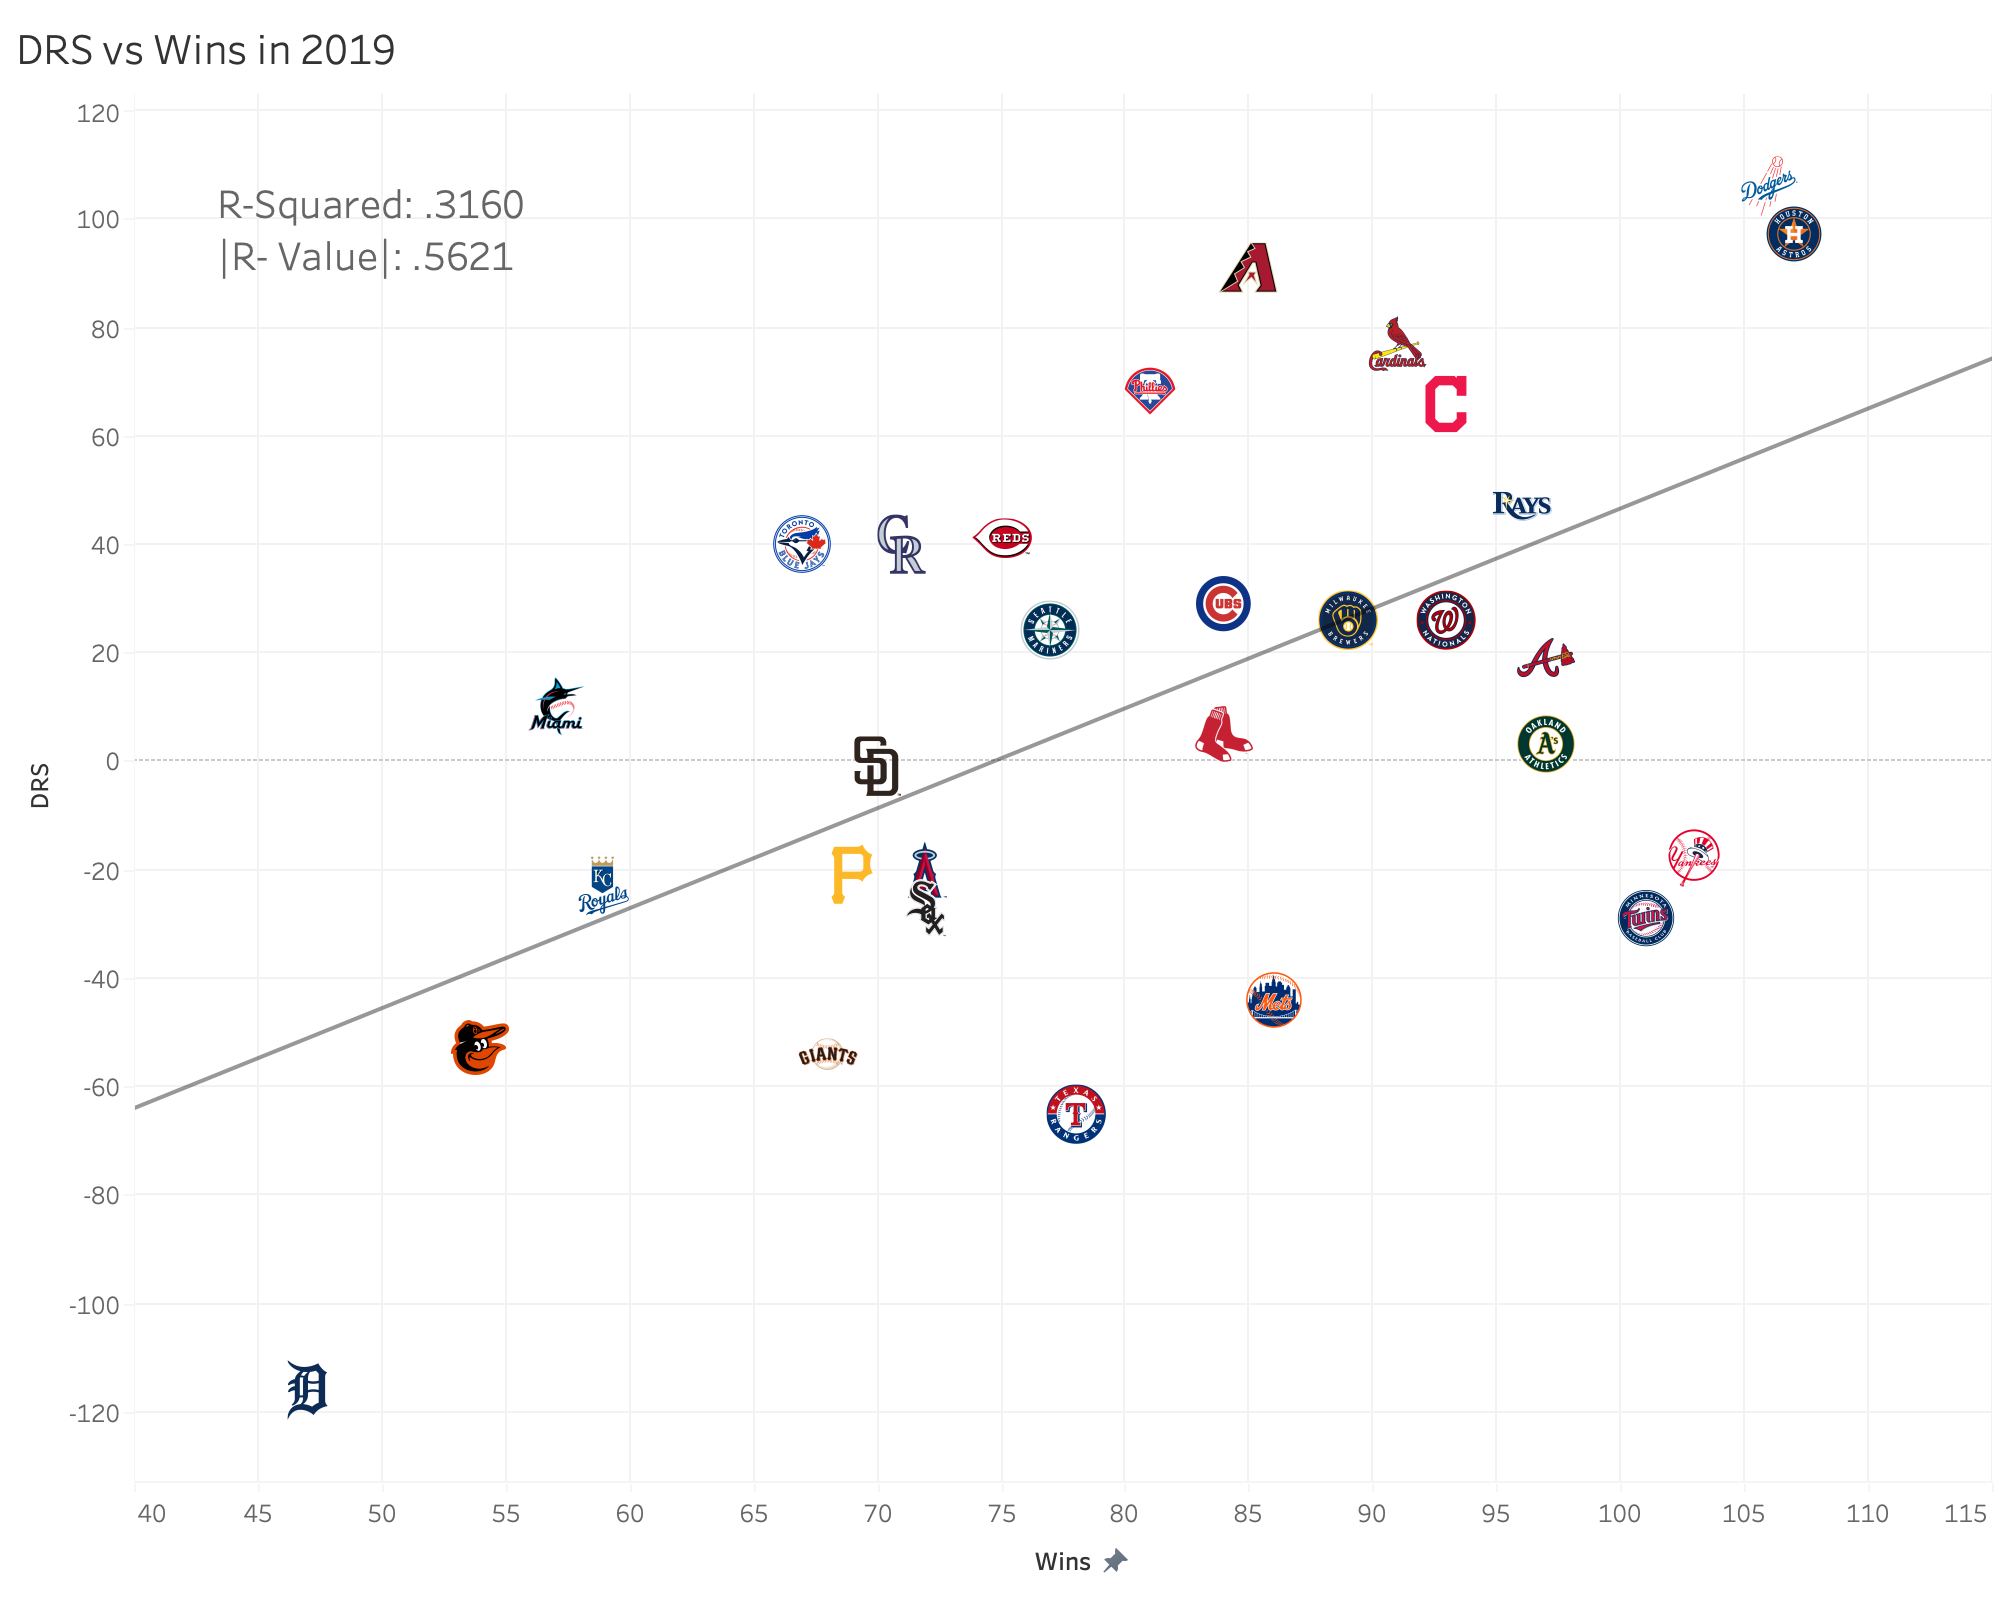
Though defense is more valuable than it seems, it still takes a backseat to the other facets. In 2021, both DRS and OAA took a steep decline in their correlation value. While offense and pitching were consistently near the top, defense struggled to even keep up and eventually fell off. With this information, a team like the Phillies that prioritized their offense at the expense of the other facets this offseason should be finding success. Yet, they still find themselves nine games below .500 nearly 60 games into the season despite seeing an unexpected improvement in the pitching department. The Phillies expected an offensive powerhouse to compensate for their lack in other areas when they signed Schwarber and Castellanos but early into their season their wRC+ ranks 16th in baseball. Their dearth of offense explains the Phillies’ shockingly lackluster shock to the season.
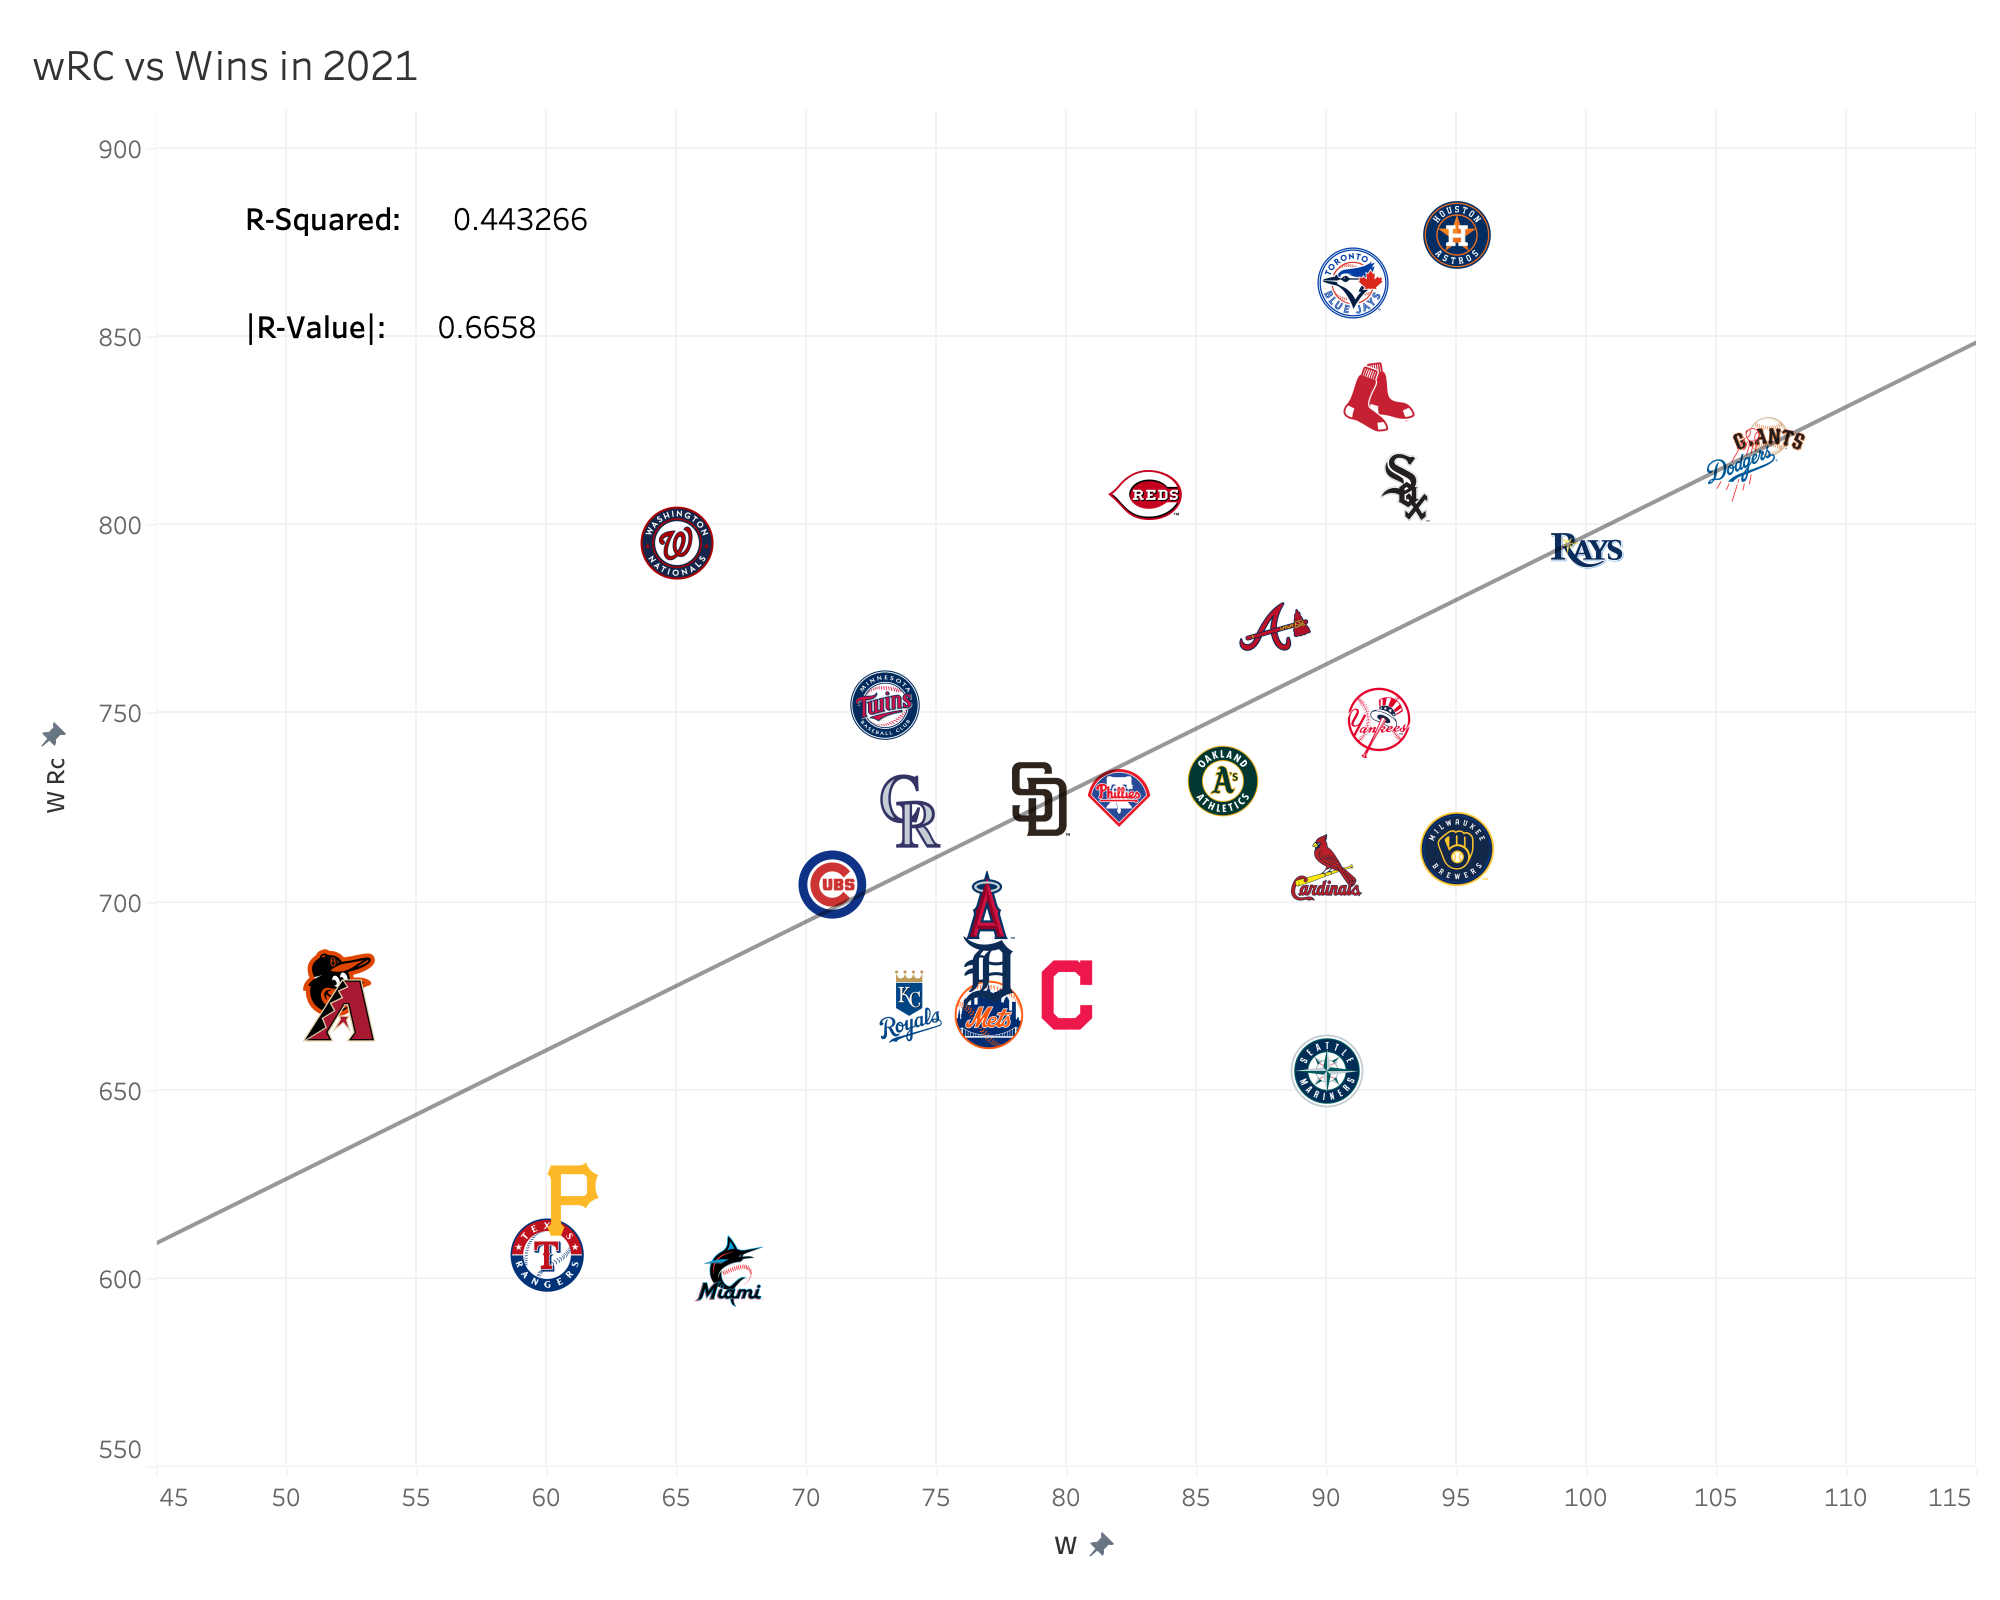
For teams who are already well-off offensively and can spare a lineup spot, a defensive specialist can be a very effective budget move to look for in the free-agent market. The Blue Jays, who led the league in OPS last season) tried a similar approach this offseason but in a different market when they traded for Raimel Tapia this offseason.
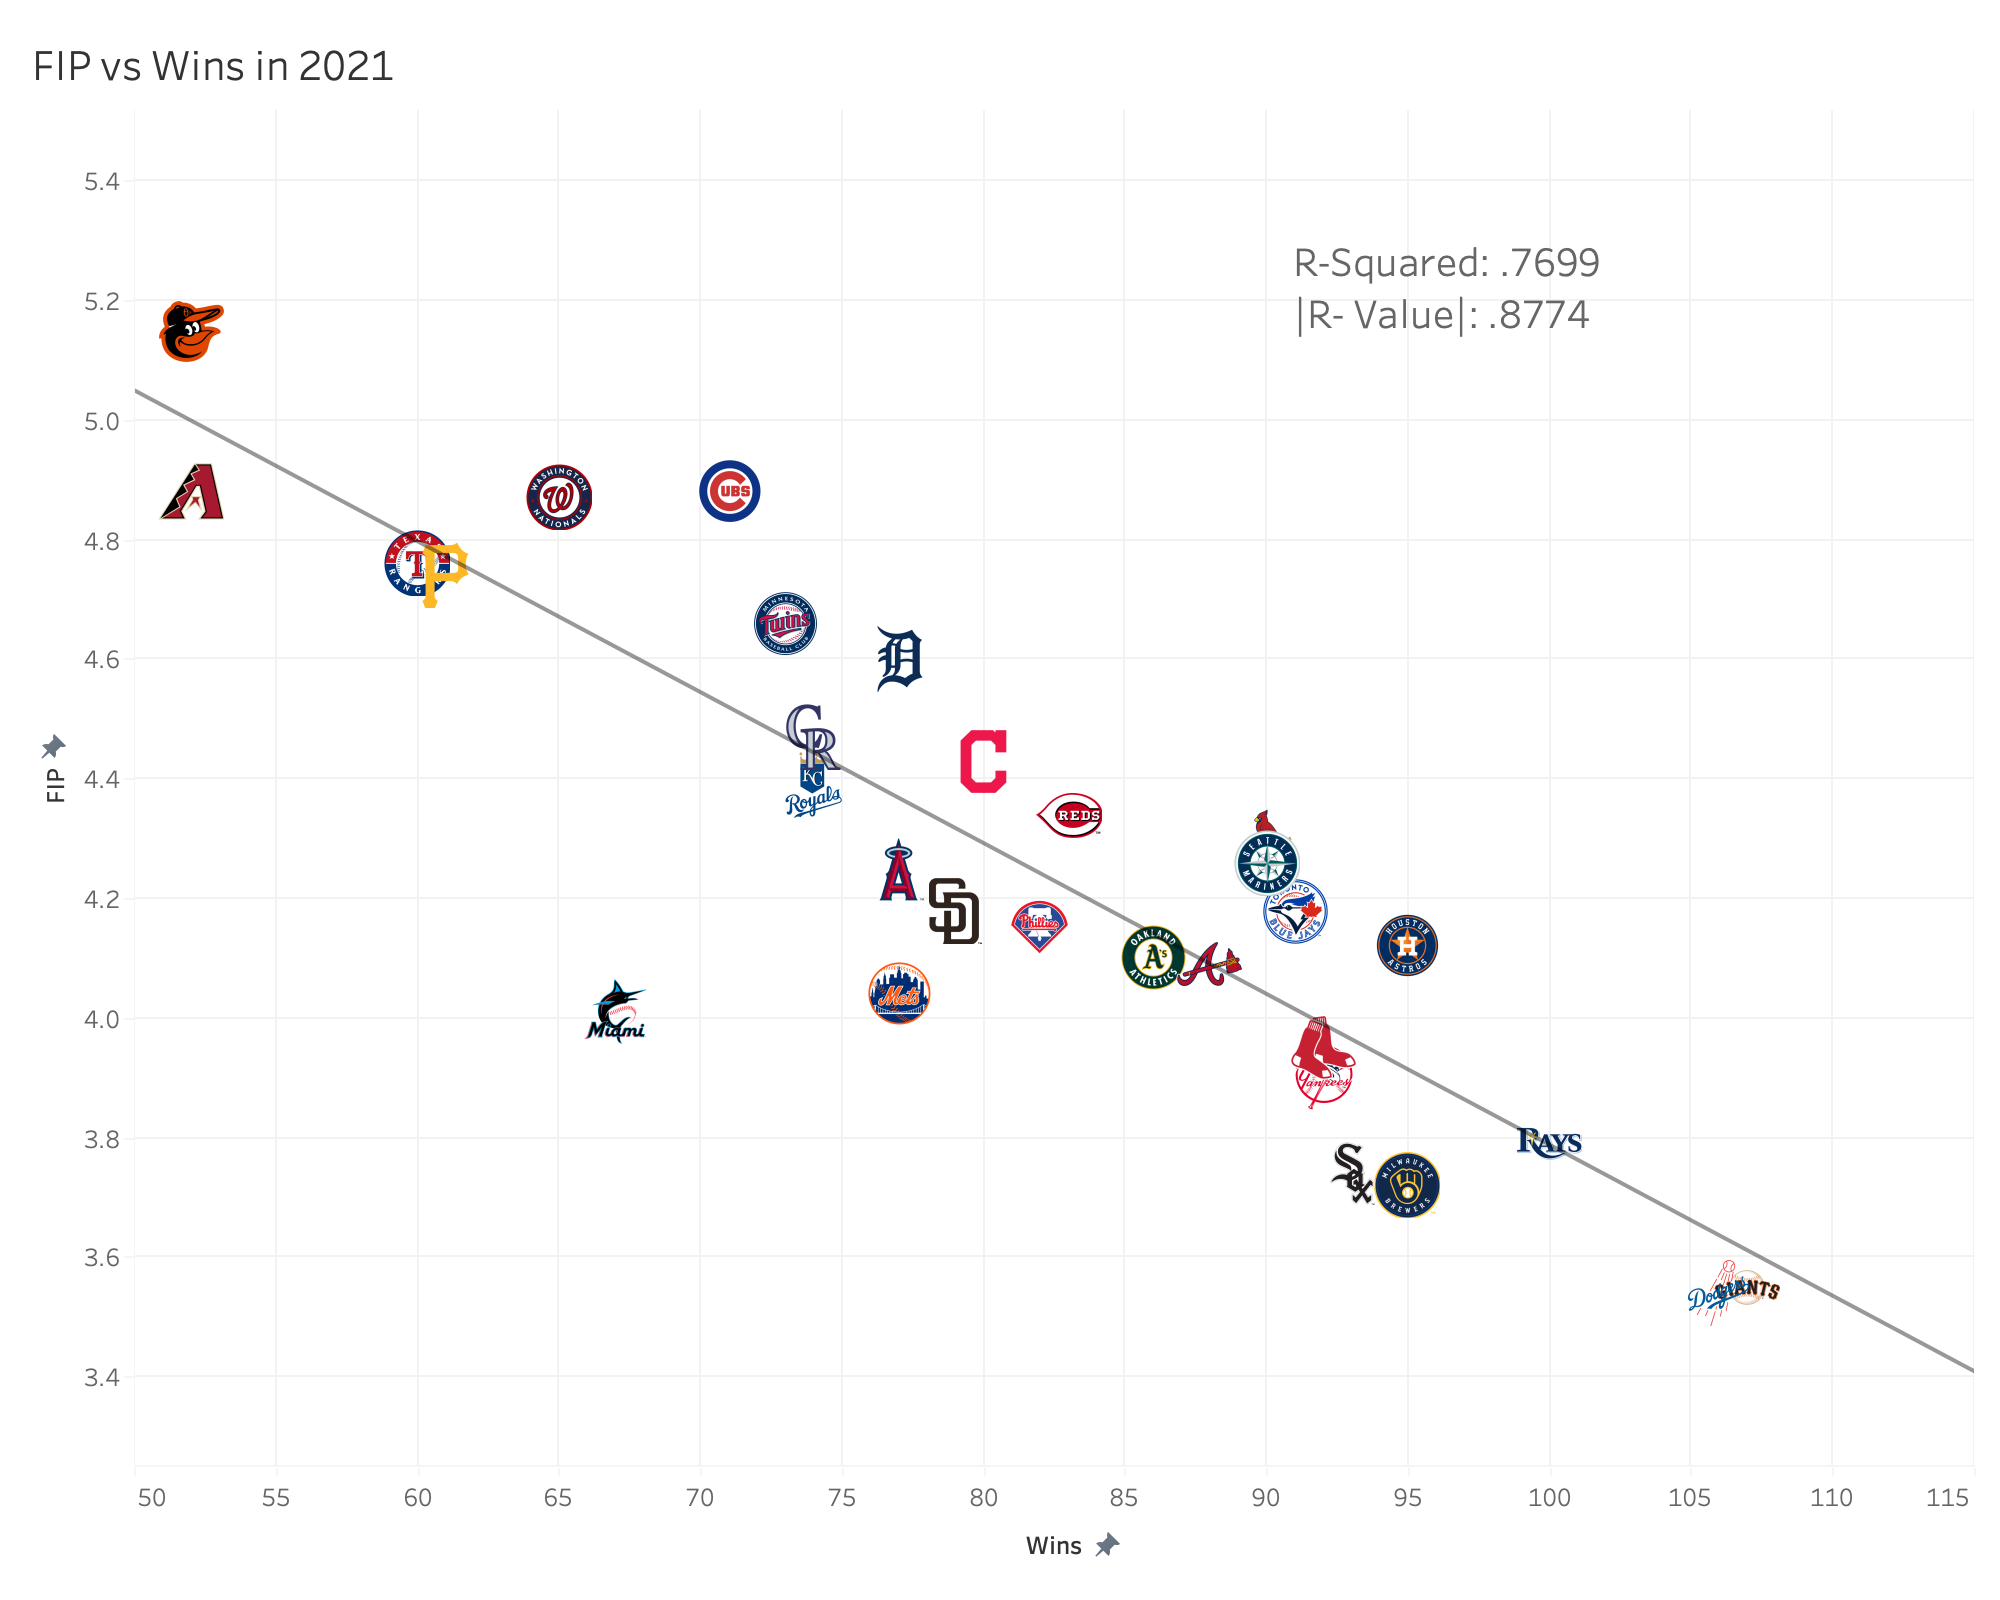
Keeping in mind the influence that pitching and hitting plays, we can better evaluate how talented Shohei Ohtani is. A star pitcher excels at pitching but he’s rarely in the middle of a play defensively and almost-never contributes on offense. A position player can excel at the plate and at times, like with Carlos Correa, he can also excel on the field but what if we were able to get the best of both worlds? Ohtani provides that in a way that no one else in the league can. In his MVP season last year, Ohtani had the fifth-highest wRC+ while being in the 68th percentile in FIP amongst pitchers with at least 130 innings. With Byron Buxton and Mike Trout dealing with lingering injuries, doubts were sure to plague whoever won AL MVP in 2021 but Ohtani left no doubt in his historic campaign.


