Higher Stakes, Higher Spin: With the season winding down, were pitchers inclined to win at any cost?
By Gordon Liang | December 14, 2022

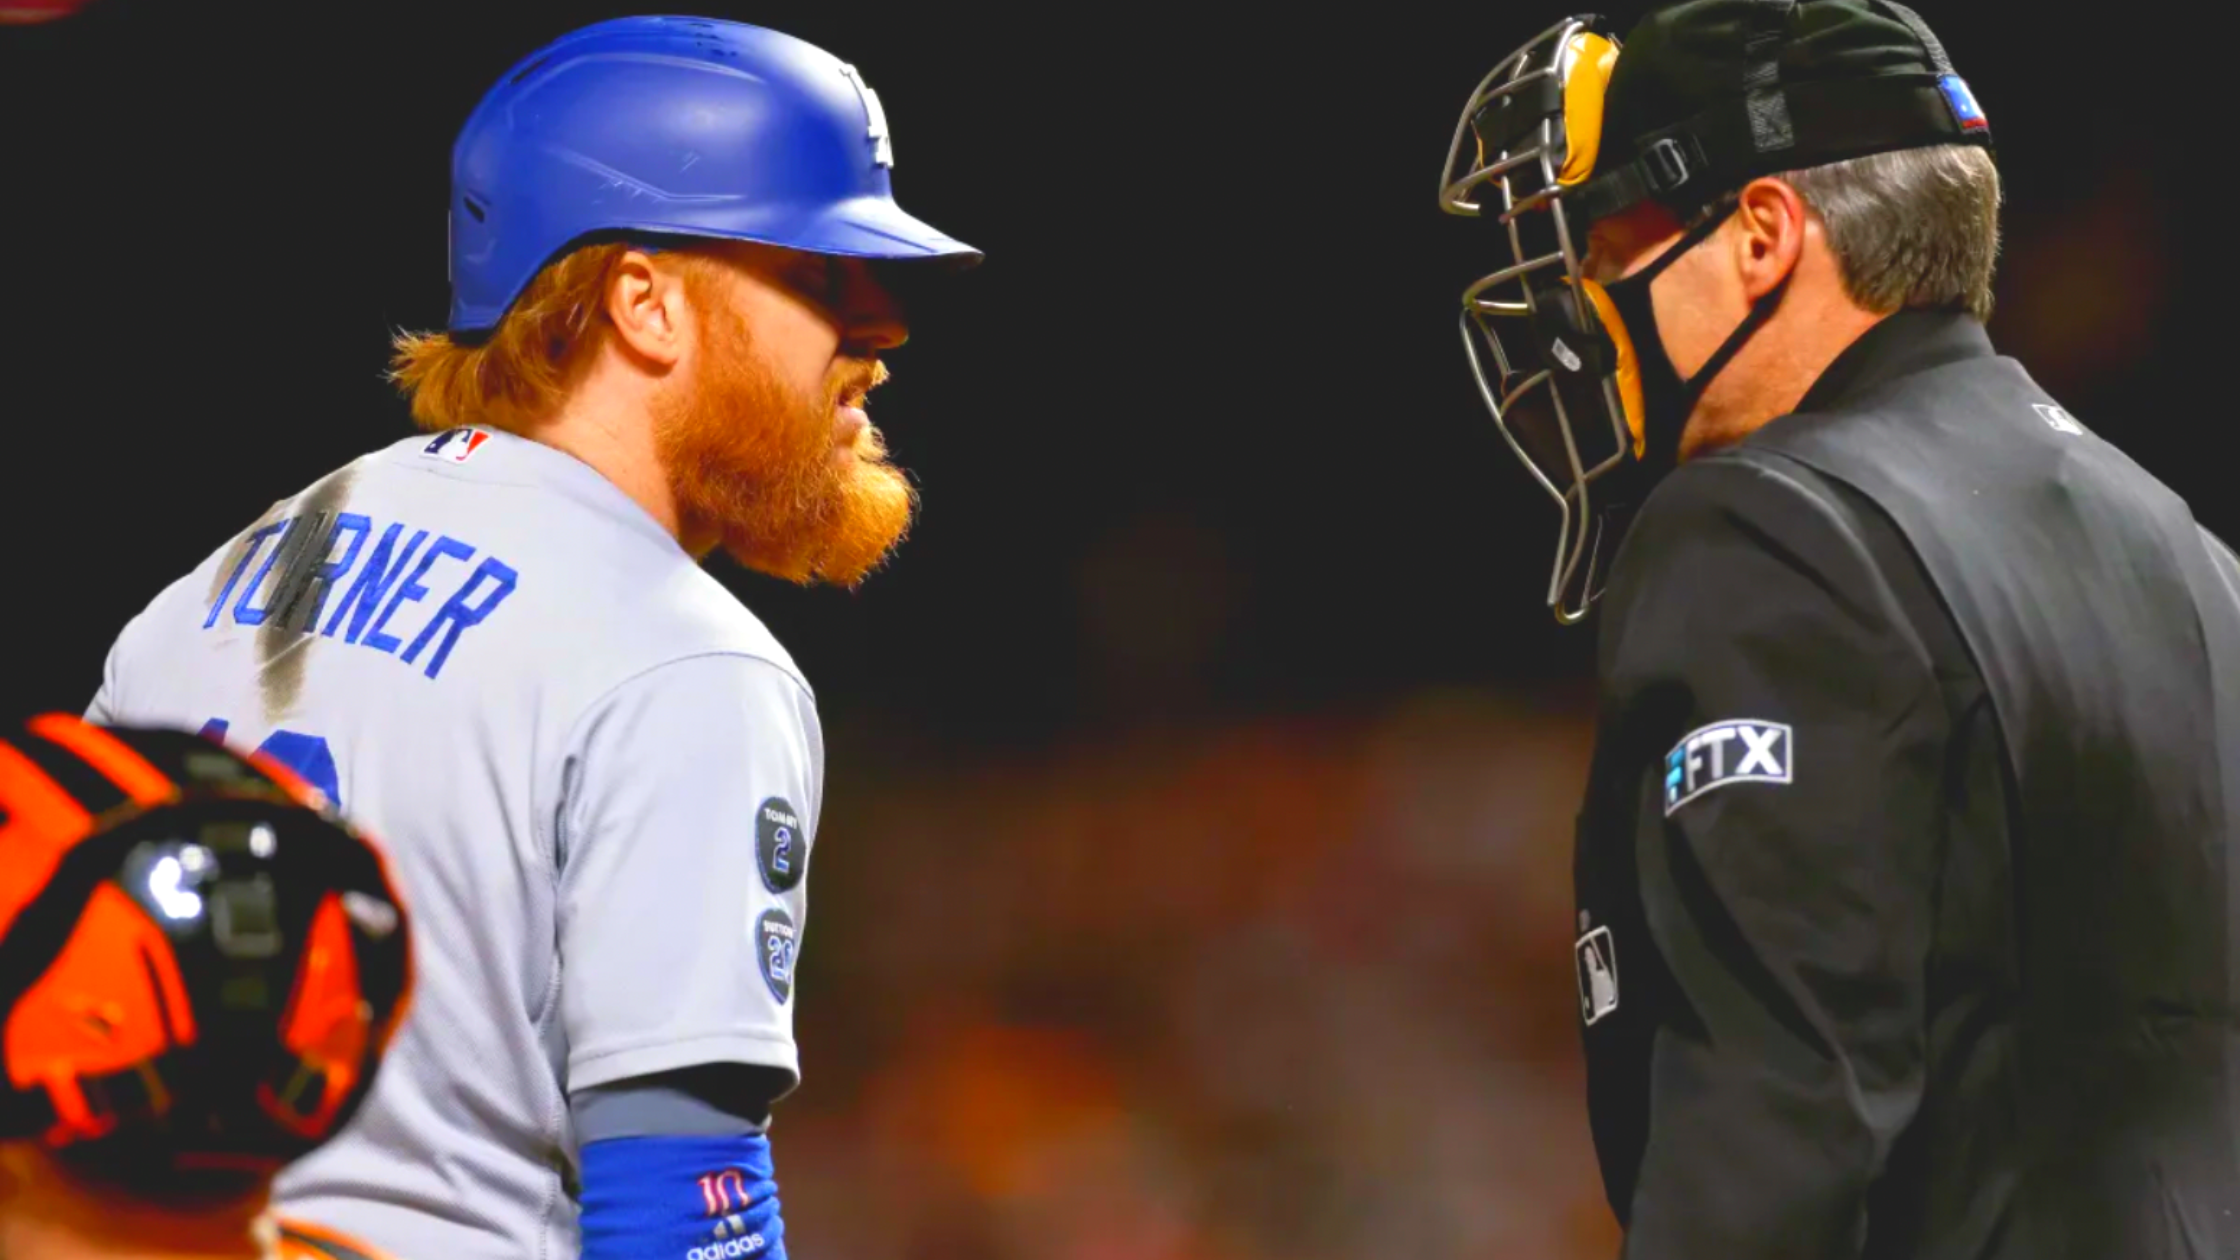
As the Mets neared the end of their road earlier this postseason, Joe Musgrove made sure the wagon kept rolling until it fell right off the cliff. Nothing was stopping the former Astro who said earlier that week he wanted to win a World Championship that “feels earned and [is] a true championship.” After five scoreless innings generating eight whiffs and four strikeouts, Mets manager Buck Showalter had seen enough. His offense wasn't picking anything up on Musgrove but he did and he asked the umpires to do something about it.
Showalter thought that Musgrove was potentially using foreign substances placed behind his ear. The umpires performed a check on Musgrove before the sixth inning started but the check revealed nothing illegal on the pitcher.
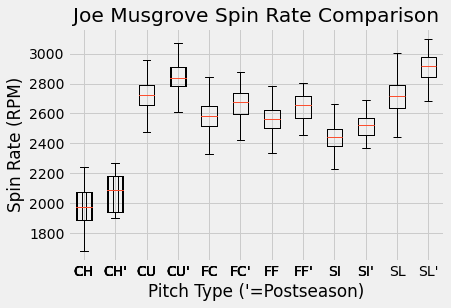
That doesn't make the situation any less suspicious though as Musgrove's spin rate that night - and throughout his time in the playoffs - increased across the board at a somewhat-alarming pace. When all was said and done, Musgrove saw his average slider spin rate increase 192.6 revolutions per minute (RPM) in the postseason compared to the regular season and his curveball experienced a 116.26 RPM increase. All of his other pitches experienced increases as well but none as drastic as the curveball and sliders.
To test whether he simply experienced a random stretch of greatness, 100,000 random samples for each of his pitch types were taken from his regular season pitches and the means and medians were compared to the data collected from the postseason. For example, Musgrove threw a total of 100 fastballs in the postseason so 100,000 samples of 100 regular season fastballs were taken and the means and medians of each sample was compared to that of his actual postseason values. If a sample yielded a value equal to or above the postseason value, it would be labeled as consistent and the amount of consistent samples divided by the amount of total samples would be our p-value. Therefore, the lower the p-value the less consistent his playoff performance was with his past performance. None of his pitch types yielded an optimistic conclusion as they all had a p-value well below .05. Four of his pitch types (CU, FC, FF, SL) yielded p-values of 0 for both mean and median testing. Shown below is a box and whisker plot of his different pitch types with those labeled with a prime representing playoff pitches. A caveat to watch out for here that comes with showing all the pitch types on one graph is that the differences look smaller because the y axis is showing a longer RPM range than it typically would if we were to graph each pitch type individually.

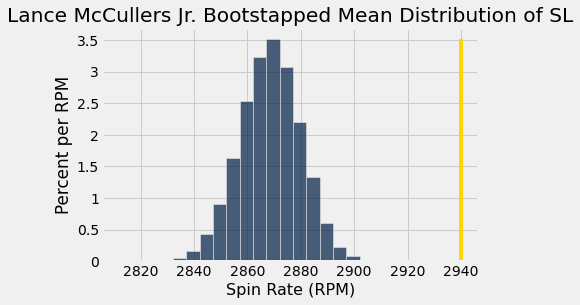
The slider - which was thrown 52 times in the playoffs - is by far the most suspicious in Musgrove's repertoire. The histogram below shows a distribution of the means of his bootstrapped slider samples. The gold line represents where his postseason mean spin rate lies. Not only did none of the bootstrapped samples yield a mean spin rate above or equal to this postseason mean of 2907.34 RPM, none came remotely close.

Despite none of Musgrove's spin rates being consistent with his regular season numbers, it's hard to conclude that he was cheating as Showalter implied when he asked for a check. The extra spin can be a byproduct of numerous causes. Playing with higher stakes and a more amped-up audience can lead to higher velocity which in turn leads to higher spin (using velocity=distance/time, higher velocity would mean less time because distance is constant and thus RPM is intrinsically shifted up). It's also possible that the baseballs used in the postseason were easier to grip which would allow pitchers generate more force the baseball and lead to more spin. Whatever the reason may be, one thing's for certain: it exists.
It's salient to note that Musgrove wasn't the only pitcher who experienced a suspicious increase in spin rate. His case was just publicized the most for the spectacle the check was.
Lance McCullers Jr yielded consistent spin rates for most of his pitch types but, like Musgrove, observed a suspicious increase in spin for his sliders. McCullers's slider also yielded a p-value of 0 and it was by far his most-used pitch, throwing it 82 times in October (and November).

Despite multiple pitchers experiencing increased spin in October, this doesn't seem to have been a league-wide issue as the different-baseball theory would imply. To test it, each pitch's spin rate was measured in standard units using their regular season counterpart's mean and standard deviation. For example, Yu Darvish threw a four-seam fastball at Max Muncy at 2584 RPM. In the regular season, Darvish's four-seam had a mean spin rate of 2417.6 RPM and a standard deviation of 100.02. Thus that pitch was measured at 1.664 Standard Units. By measuring every postseason pitch in Regular Season Standard Units, every pitch in the playoffs is relative to their regular season counterpart which will then show which players, what team and if the whole league saw drastic spin rate increases. As shown below, the league's distribution is slightly skewed right but for the most part, it's normal. Where some pitchers increased spin, others saw a decrease. Had it been a glaringly league-wide issue, we'd expect to see the distribution heavily skewed right.

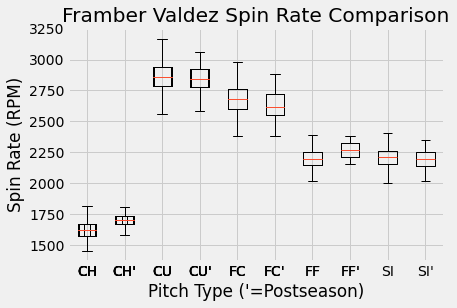
During the World Series, the foreign substance controversy took another step when those in the Phillies fanbase accused Framber Valdez of rubbing something from his hands. Ironically enough, amidst the allegations of Valdez using foreign substances, it was the game one starter of the accusing fanbase's team that saw alarming spin increases. While Valdez's spin rates yielded consistent p-values (CH: 0.15152, CU: 0.97882, FC: 0.95459, FF: 0.07926, SI: 0.93878), Aaron Nola of the Philadelphia Phillies didn't. His three most-used pitches (FF, KC, SI) in the postseason yielded a p-value of 0 in both mean and median testing. To acquit Valdez further, all of his pitch types aside from the changeup - which was thrown eight times all postseason - saw a decrease in mean spin rate during the postseason.

To reiterate, an inconsistent increase in spin rate doesn't automatically imply that something outside of the rulebook was taking place. It simply means that something is happening. One proposed reason for the increases was a spike in adrenaline and a case can certainly be made to back the theory up. Because the spin increases doesn't seem to be a league-wide issue, it's likely that this was a player-by-player incident. Nola hadn't seen the postseason in his life until this year. Musgrove hadn't seen October since 2017 and he was absolutely shelled en route to his non-“true championship” and McCullers saw only two starts last postseason before getting injured. In the years before that, McCullers was recovering from surgery or pitching to an empty crowd. All of these pitchers have reason to feel extra excited during the playoffs so we'll never really know what happened. We only know something happened this October.
All data referenced in this article is from Baseball Savant. Some pitches didn’t have spin rate data (ie the Field of Dreams game) and those pitches were excluded.


