Hypothesis Testing MLB Hitters in Day and Night Games
By Josh Richland | May 20, 2021

Prior to 1935, all Major League Baseball games were played during the afternoon. When the night game was introduced, it added a new aspect to the sport. Since day games are less convenient for spectators and certainly sell less tickets, this “novelty” seemed to provide a higher level of fan engagement. However, with the addition of quicker turnaround between day and night games, and potential differences in climate and humidity, it begs the question of whether hour of play has made a statistical difference on player performance, and thus the outcome of a game.
Hypothesis testing is a form of statistical analysis on a collection of observed data. Based on a predetermined percentage prior to experimentation (e.g. significance level), it examines the probability of achieving these test results, or p-value. A null hypothesis is the default prediction that assumes no difference or relationship in the data. The test determines whether one should reject the null in favor of the alternative hypothesis (meaning there is evidence of a correlation), or fail to reject the null (meaning there is not sufficient evidence to draw conclusions). This is dependent on the p-value’s relation to the aforementioned significance level. The lower the p-value is, the lower the probability of obtaining this result. If it is above the significance level, one should fail to reject the null hypothesis.
There are various types of tests, however, in order to examine whether time of day has an impact on the way hitters perform, a two-tailed paired sample T-Test was conducted. “Two-tailed” means that there is a statistical indifference of whether players perform better or worse, day versus night. “Paired sample” illustrates that each individual has two values associated with them, their afternoon and evening on-base percentage plus slugging (OPS). Each player’s day and night OPS from the 2019 season was recorded and studied.
The null hypothesis is that hour of play has no impact on player performance (H0: μ1 - µ2 = 0). This is the claim which one tests against. Eventually one will reject or fail to reject this conjecture.
The alternative hypothesis is, conversely, that hitters play differently in the day than in the night (H1: μ1 - μ2 ≠ 0). This is a contradicting theory to the null hypothesis. If the null hypothesis is ultimately rejected, it will be in favor of this alternative.
For the purposes of this analysis, the significance level will be set to 5% (α = 0.05).
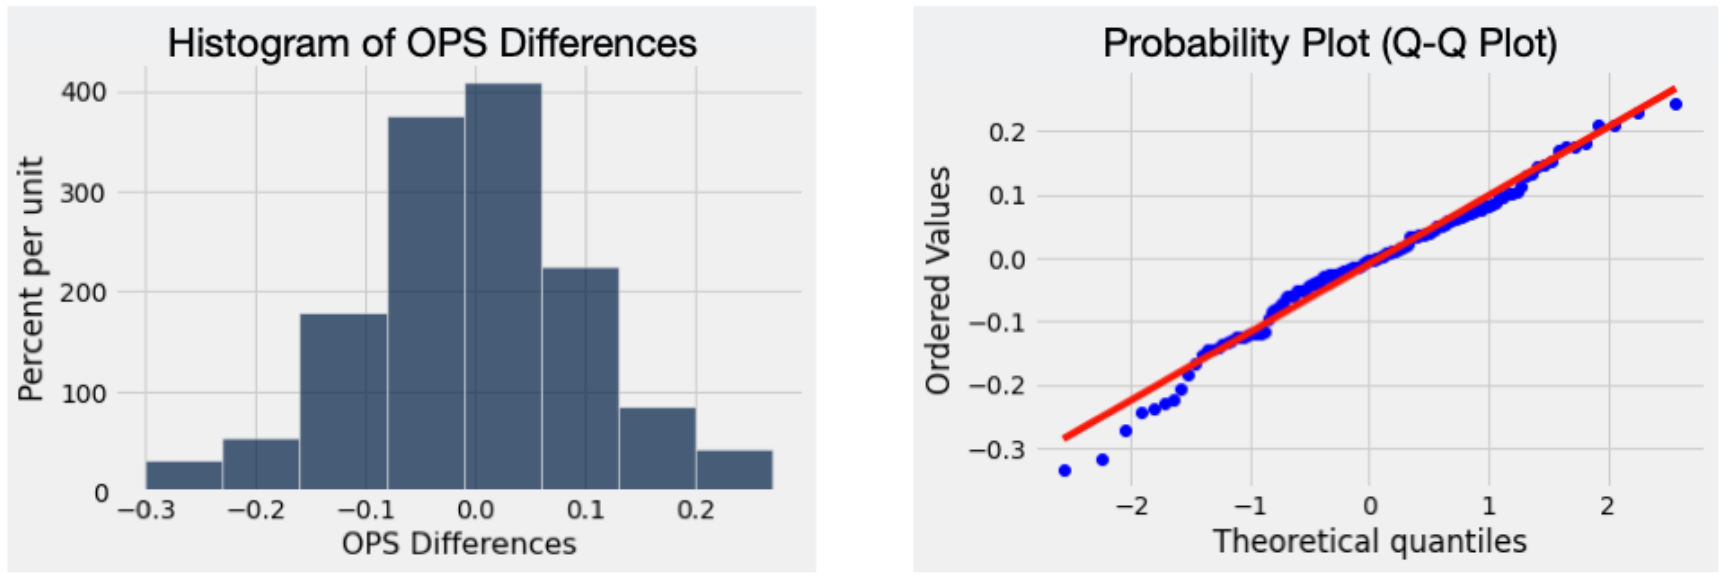
In order to be able to proceed with the hypothesis test, various preliminary conditions need to be satisfied: First, the values which OPS takes on are continuous over the interval from 0 to 5; analogously, the dependent variable is not disjoint. The second assumption is that the dependent variable is normally distributed. The Central Limit Theorem is enough to illustrate that the distribution of differences in OPS is approximately normal. Considering the size of the sample, this theorem is both applicable and sufficient. The histogram of “OPS Differences” resembles the bell curve and the diagonal nature of the Q-Q Plot below further illustrate this notion.

The third condition is independence of observations. It is possible that hitters on the same team can have an influence on each other’s in-game performance. For example, watching a teammate face a pitcher and battle off enough pitches, can result in an advantage for the later hitters. However, this is not significant enough to imply a correlation. This condition is satisfied because any relationship is deemed negligible for the purposes of this test. Finally, the data contains no significant outliers in the differences between the two groups.
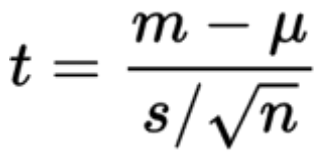
To continue with the hypothesis test, the test statistic is calculated using the formula: 
This computation results in t≈1.00045. t represents how close the observed data matches the theoretical distribution, under the null hypothesis. The obtained p-value is p≈0.31890. Since this value is greater than our previously established significance level (α = 0.05), the conclusion is the failure to reject the null hypothesis.
Finally, constructing a confidence interval can help illustrate this reasoning. This establishes a range of values for which the difference of means of OPS can fall within. A 95% confidence interval spans from [-0.0166, 0.0351]. Moreover, 0 is indeed within these bounds, strengthening the assessment of the null hypothesis. It is possible to conclude, with 95% confidence, that the true difference in population means is within this range. In other words, there is not sufficient evidence to believe that hour of play has any impact on a hitter’s performance in terms of OPS.
However, this test is not entirely conclusive. The study only examined hitters; a future experiment may investigate pitchers’ level of play. Perhaps they are more influenced by when a game starts. For example, circadian rhythm is vital to a pitchers' routine, so disrupting their schedule and body clock might result in poorer performance. Therefore, there are still many avenues to explore, in order to determine whether hour of play has a statistical difference on the outcome of a game.


.gif)