Styles Make Fights: Predicting the MLB Playoffs with a New Perspective
By Gordon Liang | November 13, 2023
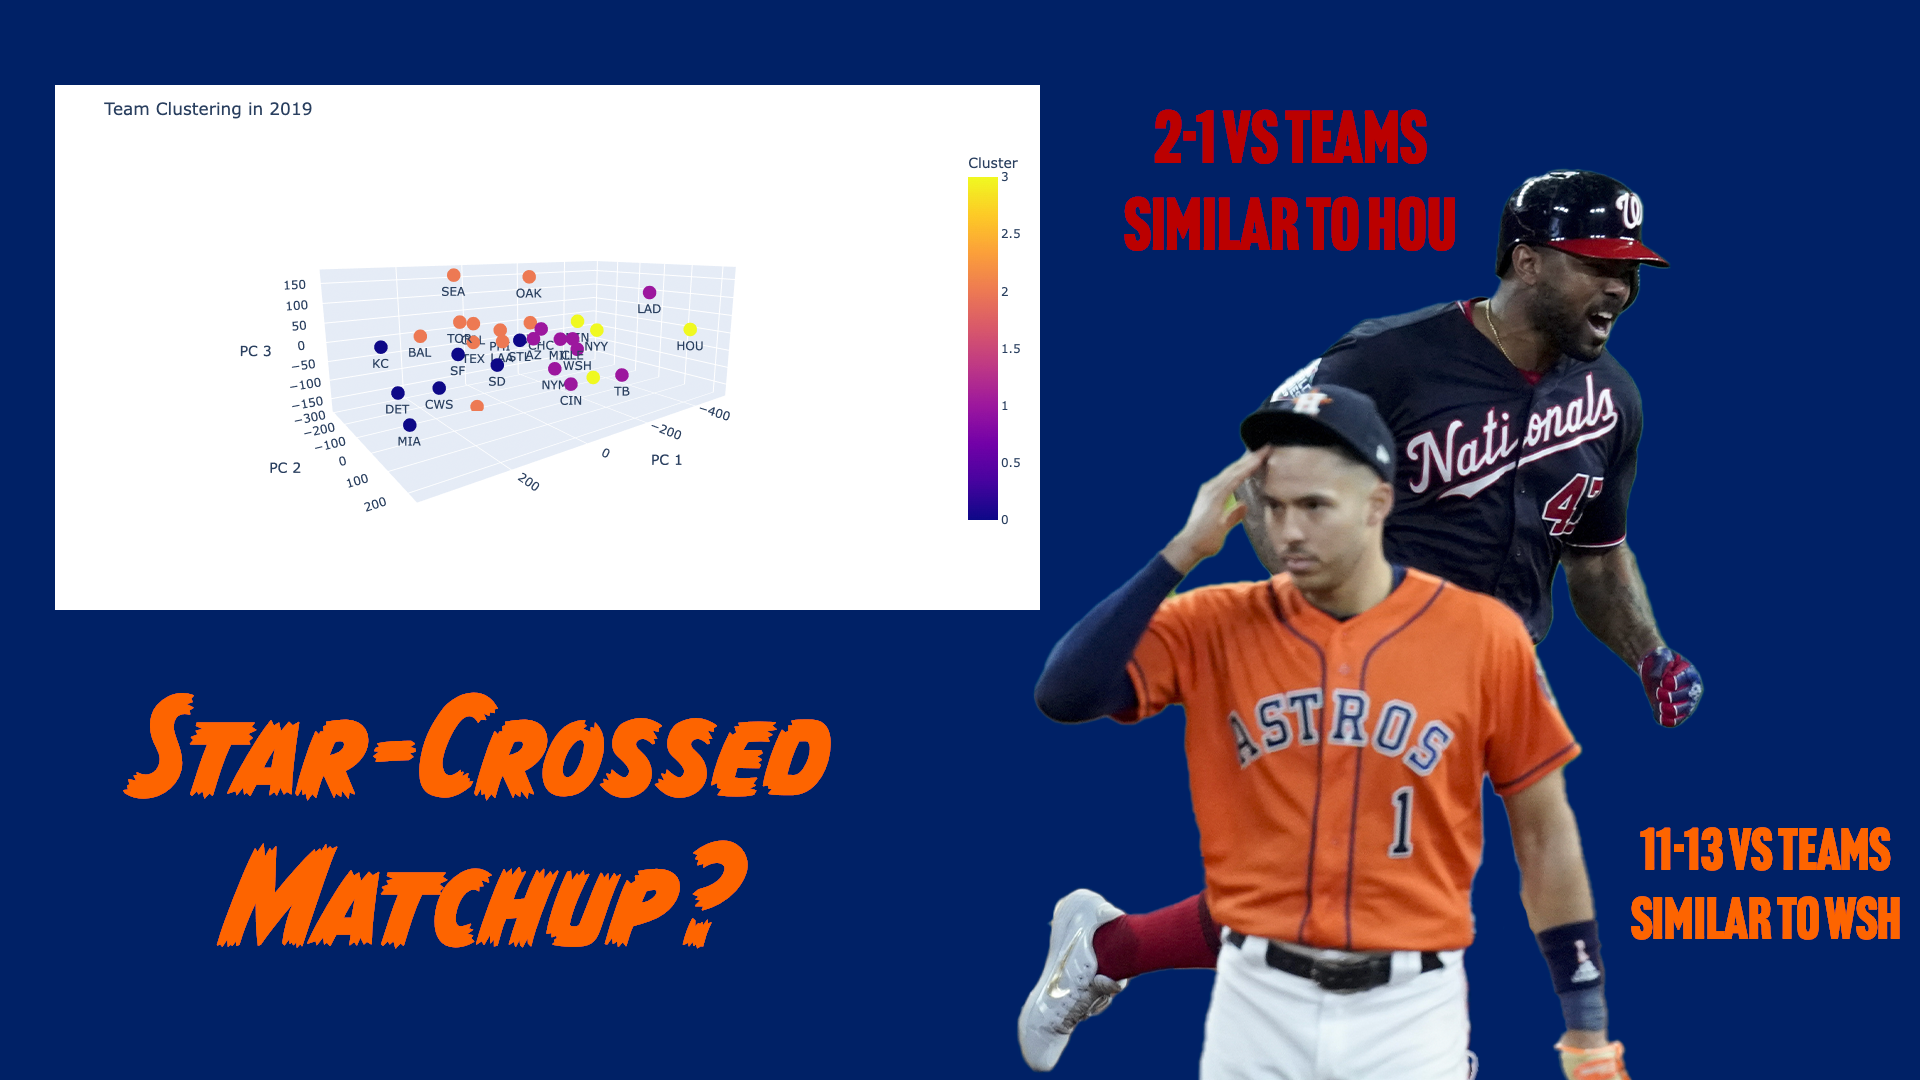
The 2019 World Series was supposed to be a formality. The 2019 Astros were merely putting the finishing touches on a historic season. The series had no business going to seven games let alone going to the Nationals. Yet it did. The Astros left the season stunned at the heroics of Howie Kendrick and Stephen Strasburg. Everyone else left wondering, “How did a 107-55 team just lose to a 93-69 team?”
But what if that’s not the right way to look at things? Since 2016, teams with the better regular season record are 43-26 (.623) in playoff series. But records can be deceiving. The Twins won their division despite having a lower record than every American League Wild Card team. Some teams have a fantastic record vs teams above .500 whereas others mainly stack their record from sub-.500 teams. Well, playoff teams are typically comprised of .500+ teams only. What if instead of just overall W-L records, we filter records to games against teams that are similar to their opponent and make predictions off of that? In this article, I explore a new approach to predicting the unpredictable and propose ways to continue building off this foundation.
The Method
The first step is to find statistics that can characterize teams and their tendencies. Some teams are offensive powerhouses, others have a stacked pitching staff and the lucky ones have both. Runs Scored/Game, Runs Allowed/Game and Outs Above Average were among the 17 statistics we used. Then with that we’d like to use K-Means clustering to group similar teams together but with 17 dimensions, issues would likely arise. So we ran Principal Component Analysis (PCA) to retain variance while reducing the dimensions to make clustering a smoother process. On average, we retained 85% of the variance per year.
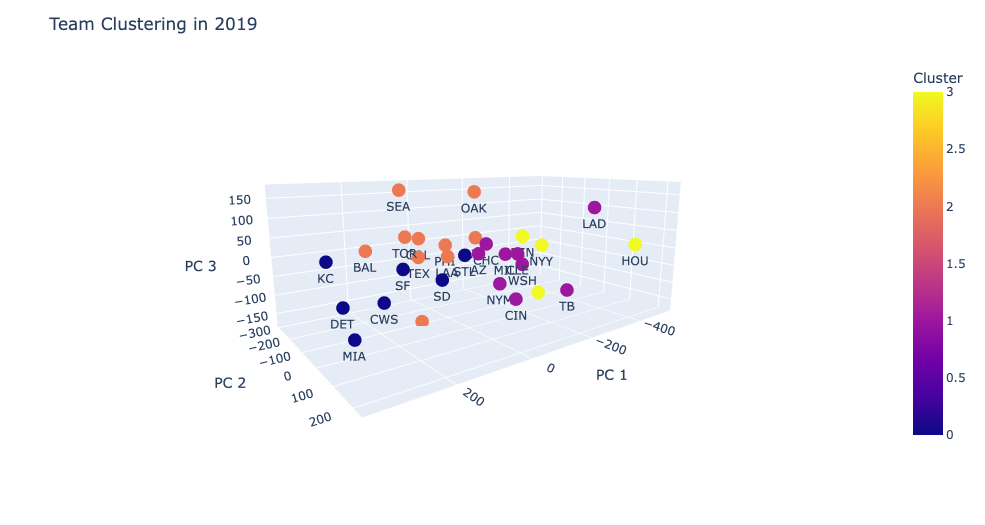
After running PCA and taking the three highest features, we ran K-Means clustering with four clusters.
With the teams now grouped in their clusters, when we make a prediction, we can narrow our scope to how teams did against teams that were similar to their opponent rather than just teams that were simply on their schedule. We now have that Team A had a WA-LA record vs teams that were similar to Team B and Team B had a WB-LB record vs teams that were similar to Team A. Using this specialized record, we define P(A) to be the probability of Team A winning a game against Team B and set it to:

This definition double-counts head-to-head games between Team A and Team B which is seemingly an appropriate way to weigh the fact that Team B is a closer indicator of its own performance than the other teams in the cluster. Note also that this definition of P(A) can be used for Team B and the property of P(A) + P(B) = 1 upholds.
At this point, enough is available to make a prediction for the series but to account for the variance in the small sample sizes of the playoffs we use the binomial distribution to calculate the probability of each team winning the series. For a best-of-x series and given P(A), we sum up the probability of Team A winning in x to 2x-1 games to arrive at the probability of Team A winning the series. For example, in the World Series, x = 4 so we sum up the probabilities of Team A winning in 4,5,6 and 7 games. This is calculated by

The first term is the probability of Team A winning the (n+1)th game (as the elimination game) and that’s multiplied by the probabilities of Team A winning x-1 games in the games before that.
Moving Forward
As embarrassing as it is to admit it, this method does a terrible job in predicting winners. It did a fantastic job in the 2019 World Series as Houston was 11-13 against the National’s cluster and the Nationals were 2-1 against Houston’s. But in the grand scheme of things, it typically does worse than just picking the team with the better record.
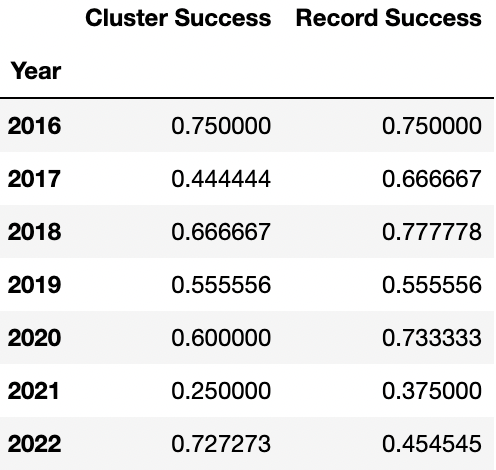
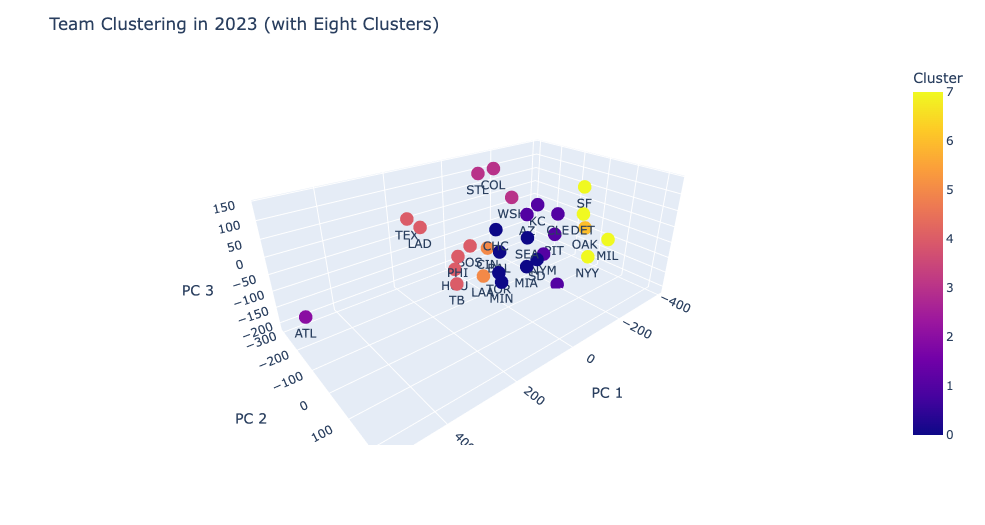
A few reasons for this and how I think we can improve upon our model involves the clustering of teams. As mentioned earlier, taking the first three principal components only maintains around 85% of the original variance on average. Taking the first four maintains 91% on average but for the sake of visualizing the clustering, we kept it at three. Another potential for improving the clustering is to utilize more reflective statistics. Due to lack of accessibility of team statistics, we were only limited to the ones provided by Baseball References and Outs Above Average from Baseball Savant. If it were to be made available, I’d seek to include more fielding metrics like Defensive Runs Saved and include batted ball tendencies from both the perspective of the hitter and when the team is pitching. Lastly, increasing the amount of clusters can give us an even more specialized record when comparing teams, especially when done alongside adding a fourth principal component to maintain more of the variance. Looking into the 2023 clusters, we notice that the Atlanta Braves– after a historic season on offense– was in a league (and cluster) of their own which is arguably justified but likely had an effect on the predictions and reduced the amount of meaningful clusters to three.
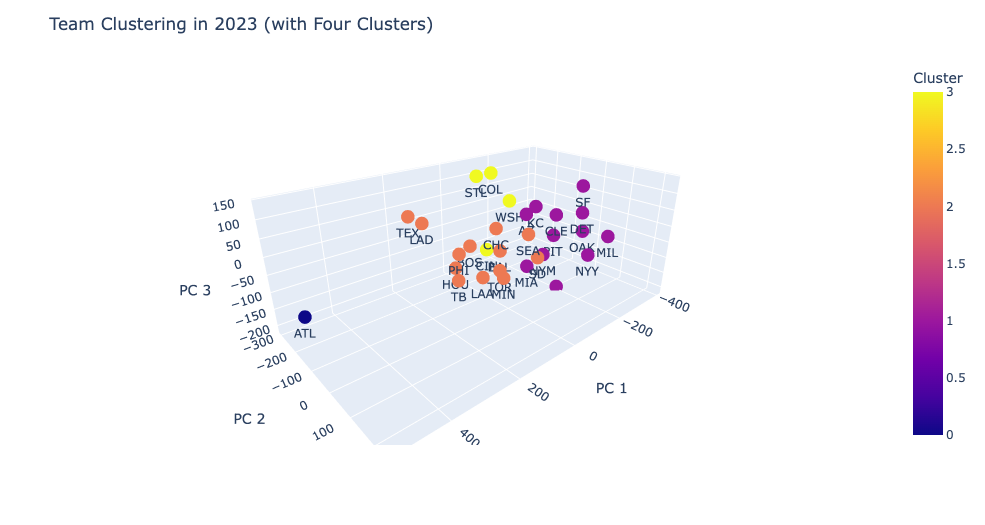
If you increase the number of clusters to eight, the Oakland A’s also found themselves in a cluster of their own after a historically obvious tanking season and may lead to more accurate groupings when predicting the playoffs off of performance against similar teams.
