The NBA’s Most Improved Player Award: How Players Have Taken the Next Step
By Alon Tamir | November 15, 2021

Each year dating back to 1985, one NBA player has received the Most Improved Player award for showing the most progress during the regular season. So how do voters decide who has shown the “most progress”? What kind of improvement do voters tend to reward? These are some of the questions I attempt to answer in this article.
Past WinnersThis award is unique in that it’s the only award which requires voters to evaluate not only a player's body of work in the current season, but also his body of work in the prior season. No player who has been to an All-Star in a previous season has gone on to win the award, which emphasizes that voters aren’t just rewarding players who see the biggest increase in value, but rather voters are looking for players who have risen from relatively little prominence. To voters, going from being all All-Star talent to MVP candidate isn’t as worthy of this award compared to a rotation player rising to be an All-Star even if the former case constitutes a larger increase in performance.
So what does the average MIP award winner look like? This graph is showing the average change in performance for the winners of the Most Improved Award across various statistical categories.
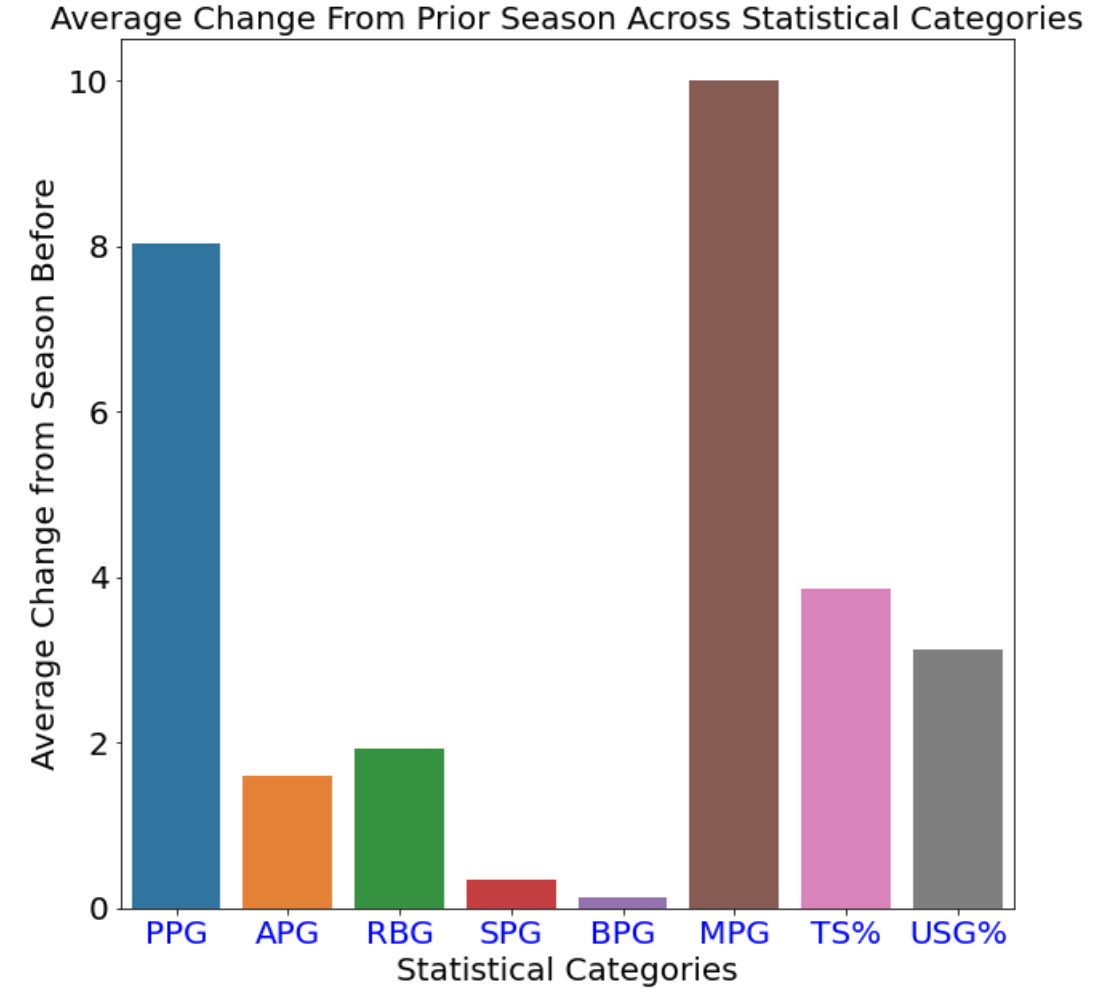
As we can see, winners tend to see a massive increase in their scoring, and also see an even bigger jump in their playing time. However, within these averages of the winners, we can see a distinction between two groups. The first group consists of players that won the award partly by seeing a big increase in usage percentage. The second group consists of players who didn’t necessarily see a big increase in usage percentage, rather they won the award by becoming more efficient. To illustrate this point, I split the winners into two groups, players that increased their USG% by more than 3.5%, and those who didn’t. Usage percentage is described by Basketball-Reference as being “an estimate of the percentage of team plays used by a player while he was on the floor”. In other words, it can be thought of as the “scoring burden” that a player takes on.
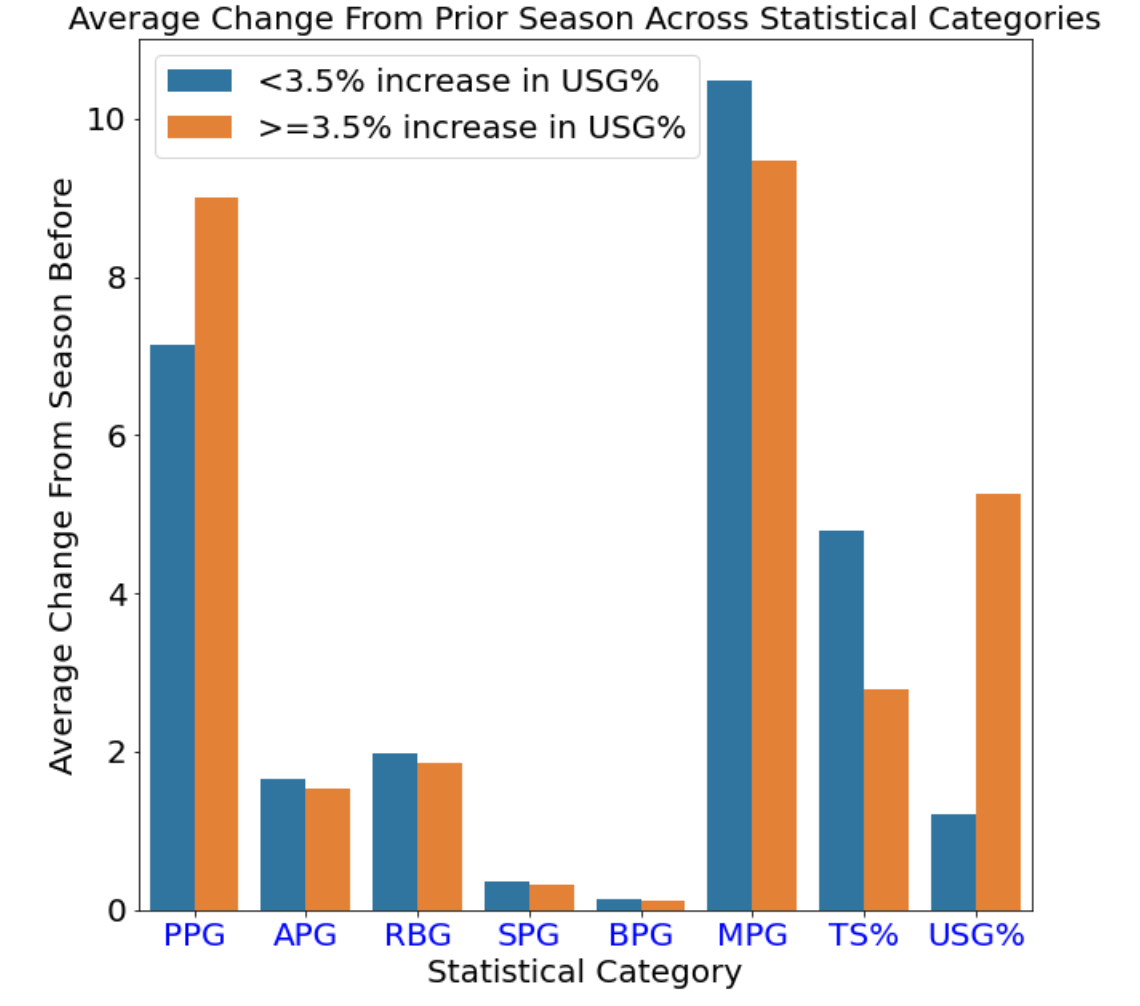
Interestingly, those who saw a big increase in USG% on average had a smaller increase in minutes played when compared to those who saw a low increase in USG%. However, the graph does show that those who saw a low increase in USG% did have a higher average increase in TS% compared to those with a big increase in USG%. This clearly divides the past winners of the Most Improved Award into two groups, those who saw a large increase in their role as a scorer, and those who took on a similar scoring burden from the previous year, yet still managed to improve through a considerable bump up in efficiency.
Another key point about this award is that it skews heavily towards rewarding offensive improvement. This shouldn’t come as a surprise, it’s much easier to look at end of season stats and see how a player has improved in points or assists per game, but it is much harder to look back and know how much a player has improved on the defensive end over the course of a year. Tracking defensive improvement usually requires intensive film study, which most award voters are less inclined to do compared to just looking at box score numbers. To quantify this phenomenon I looked at LEBRON data going back 2015, which is an advanced stat created by Basketball Index. The stat is broken into two halves, as O-LEBRON tries to quantify performance on the offensive end, and D-LEBRON does the same thing for the defensive end.
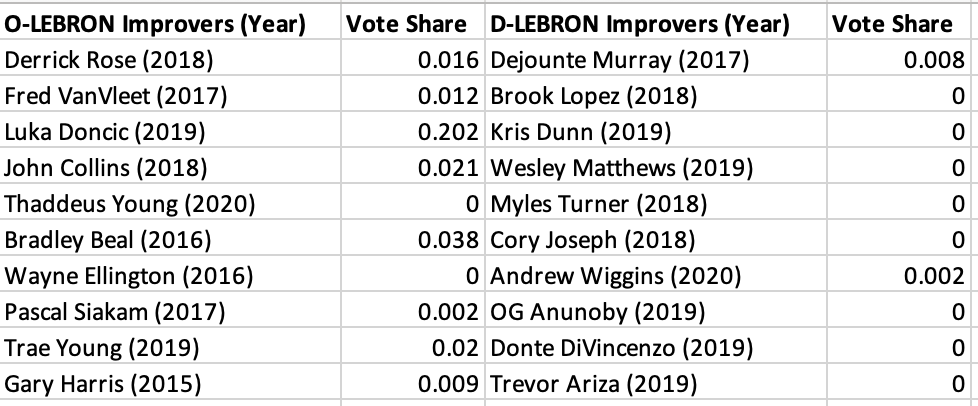
The table above is plotting the 10 players who saw the biggest increase in O-LEBRON relative to their peers that year and their share of the Most Improved Award player vote, as well as the same thing for D-LEBRON. Since 2015, out of the top 10 players who saw the biggest increase in O-LEBRON relative to their peers that year, as the table above shows, 8 of them received some share of the vote for Most Improved Player. Looking at that same stat for D-LEBRON, only 2 out of the top 10 improvers received any share of the vote for Most Improved Player. Improvement can be difficult to track, but it is usually much easier to do so on the offensive end.
The ModelI wanted to build a model that tried to predict who might win the Most Improved Player award this coming year. To do so, I looked at various box score stats and True Shooting % to predict the share of the Most Improved Player vote a player will receive. After training the model on the past 5 years of data, I had it make predictions for who will win the award based on games through November 6. The top 5 players in predicted vote share were Miles Bridges, Paul George, Dejounte Murray, Ja Morant, and Harrison Barnes. Since Paul George is already a multi-time All-Star, he is very unlikely to win the award, we can exclude him and see that the next player up in terms of predicted vote share is Tyler Herro. If we look at the market consensus for odds on the 2021-2022 Most Improved Player award provided by BettingPros, we can see that my model performs fairly well.
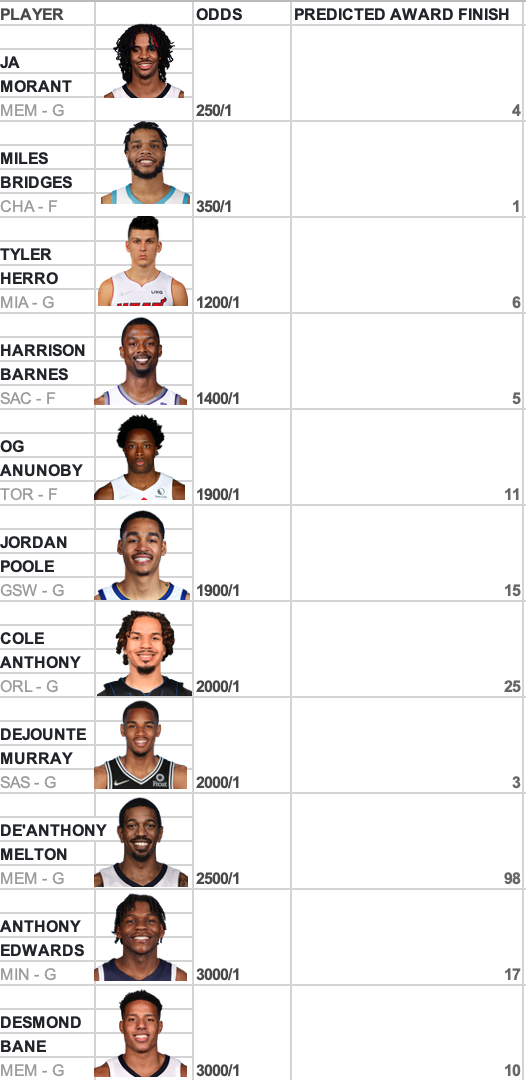
Out of the top 15 most likely players to win the awards according to the odds, 10 of them are in the top 15 of my model’s predicted vote share. The table to the right is comparing the ten players with the shortest odds to win the award (11 since Bane and Edwards have the same odds) versus what place my model thinks these players will come in for the award. As you can see, the two players with by the far the shortest odds, Ja Morant and Miles Bridges, come in at 4th and 1st respectively in my model’s predictions.
The model I described above is a linear regression model, and without getting too technical, one of the consequences of using a linear regression model is that it is not ideal for predicting vote shares where a majority of the players will receive no share of the vote and only a handful of players will receive any share of the vote. To remedy this issue, I also trained a logistic regression model on the last 5 years of data. However, the only problem with using a logistic regression model is that it cannot predict what share of the vote a player will get, it can only predict whether a player will receive any share of the vote at all. That being said, my logistic regression model produced results not too dissimilar from my linear model. It predicted that the only players who will receive any share of the Most Improved Player Award vote will be Jakob Poetl, Paul George, Miles Bridges, Cole Anthony, Tyler Herro, Harrison Barnes, Desmond Bane, and Ja Morant.
To have a point of comparison for my models, I wanted to look at the change in players’ DARKO, an advanced stat similar to LEBRON. Like LEBRON, DARKO is an attempt to create an all-in-one stat that describes and predicts player performance. Thankfully, the creator of DARKO, Kostya Medvedovsky, tracks the change in DARKO for players from last year to this year. As of the 6th of November , the top 5 non-rookies in terms of positive increase in DARKO from last year are Darius Garland, Gary Payton II, Georges Niang, Cole Anthony, and Tyus Jones. Out of the top 15 players most likely to win the award according to BettingPro’s odds, only 2 of them appear in the top 15 of the biggest improvers in terms of DARKO. The conclusion to be drawn from these results isn't that my simple models are a better indicator of improvement than the DARKO model, rather that they’re modeling different things. The DARKO model is trying to quantify performance, while my models are trying to predict what types of increases in performance the voters will reward. The result of this is that my models only look at the things voters seem to care about, box score stats, while DARKO considers a wide array of data in an attempt to capture overall performance, a seemingly futile exercise when trying to predict who the voters will reward.

.gif)