Defensive Backs or Defensive Line? Who Do You Pay?
By Archit Raichura | November 29, 2020
Through recent years of NFL player transactions, there has been an emphasis on acquiring talented DBs. Miami paid Xavien Howard a handsome sum, then just a year later signed another elite corner in Byron Jones. Anecdotally, the Patriots, with reigning Defensive Player of the Year CB Stephon Gilmore, have been known to follow the same pattern in paying for elite defensive backs. Gilmore, Patrick Chung, and the McCourty twins all serve as examples of such on their team right now. However, other teams have made more massive investments in their defensive lines in recent years: the Packers, the Bears and the Bills all being examples. Additionally, the 49ers are yet another team to place massive importance on the pass rush, however their costs along the defensive line remain limited, as most (with the exception of Dee Ford) are on rookie contracts for the 2020 season. Few teams focus on off-ball linebackers, like the Seahawks. Notably, however, linebacker and defensive line costs become muddled as EDGE rushers are sometimes listed as outside linebackers and thus may be counted under that category depending on the system they play in. However, the source used for positional spending data, overthecap.com, did have an EDGE position listed that was counted towards defensive line spending.
A note about the methods used for this article is that the Football Outsiders’ DAVE metric was used to grade overall defensive play by a team as opposed to their DVOA metric because DAVE considers preseason outlook and therefore adjusts for some variation in the difficulty of teams played so far in the 2020 season and gives a better idea of what the full season expectation looks like. Using pure DVOA, based solely on the results on the field through 5 weeks, would be somewhat disingenuous. DAVE involves DVOA (Defense-adjusted Value Over Average) and preseason expectation. A final disclaimer is that percentages of the cap were not used because dead cap (not being spent on players on that team this year) would influence the total cap.
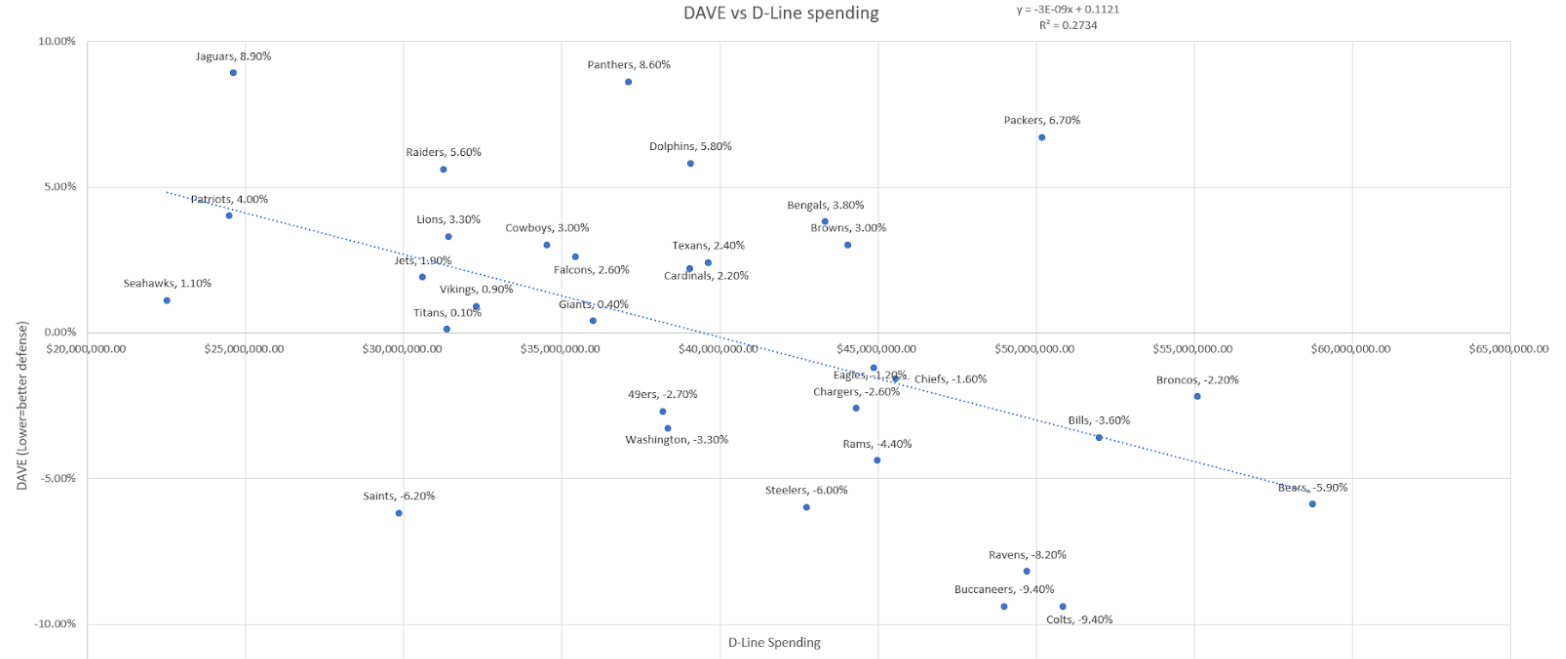
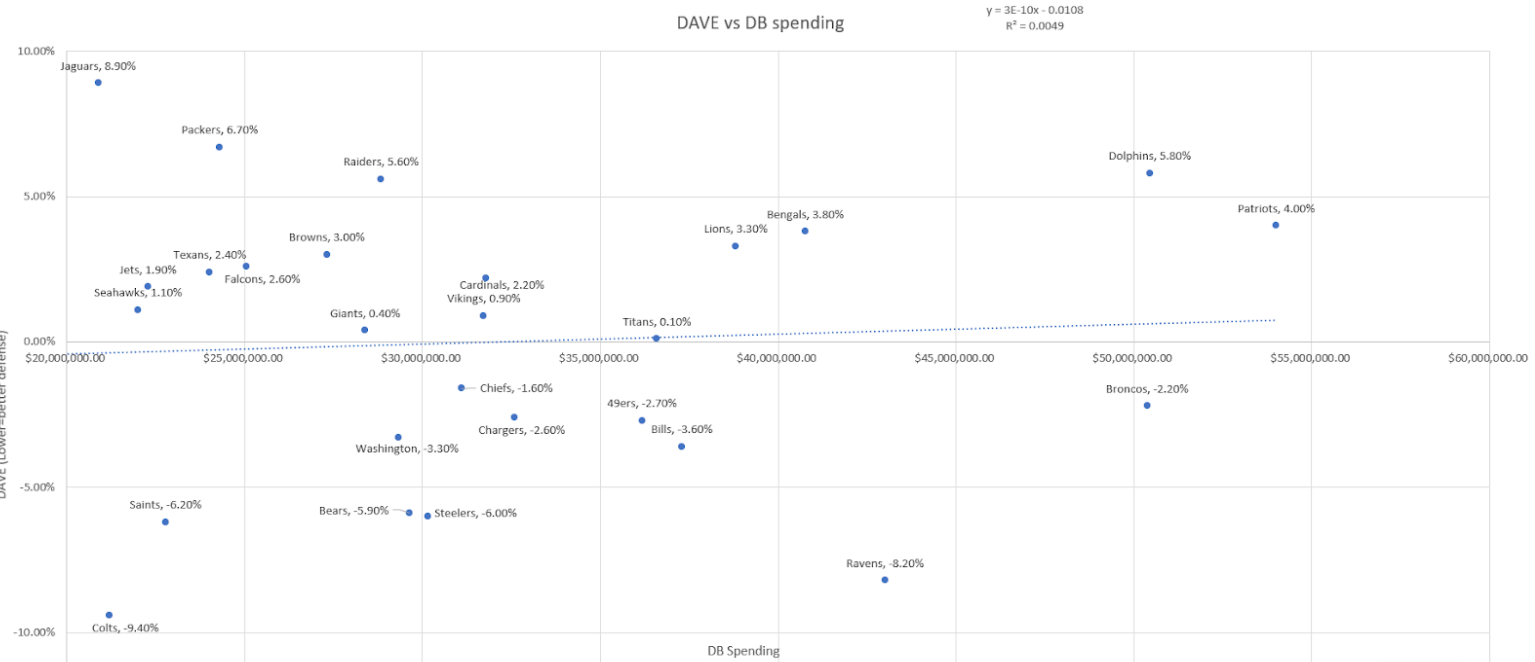
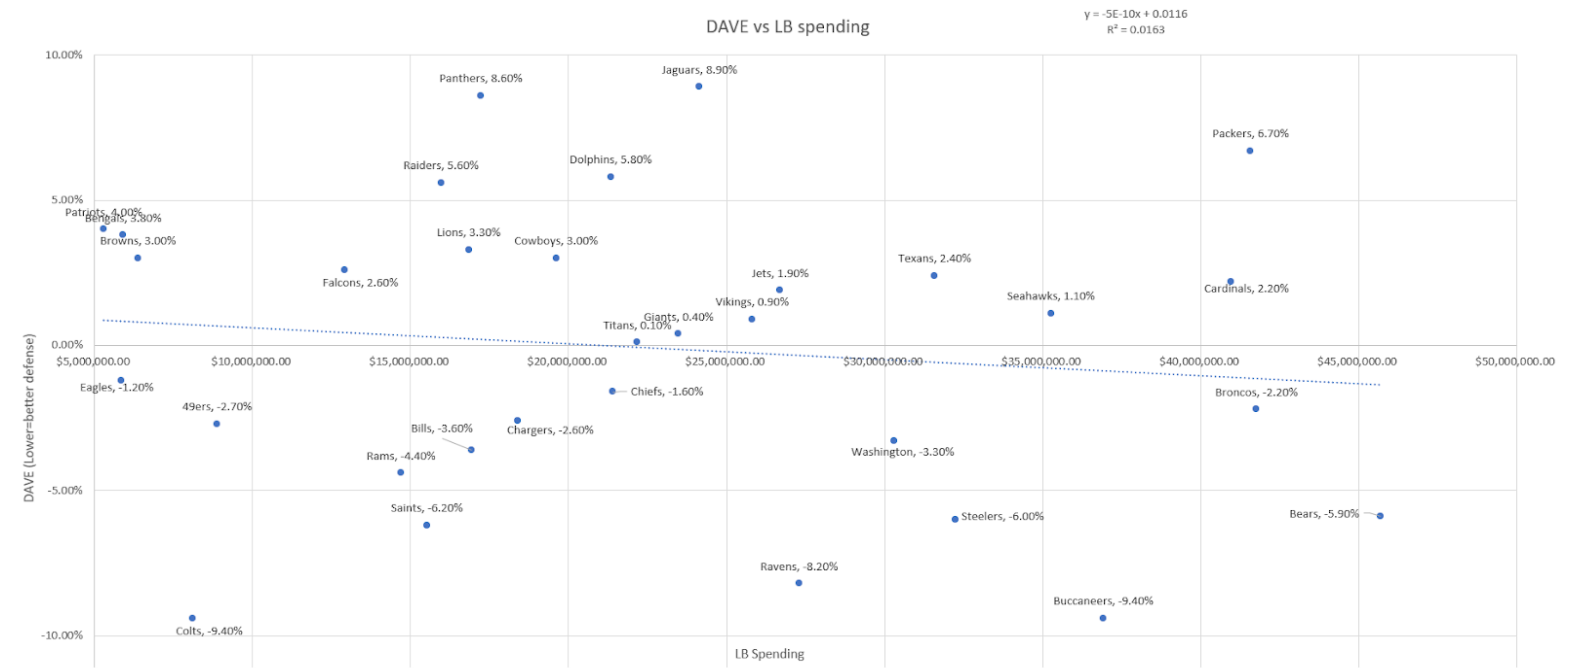
Initially looking at the first three figures, the only graph that shows an obvious correlation between spending at that position and DAVE is the first one, defensive line spending. The correlation coefficients (R2 values) suggest the same: DAVE vs Defensive Line has a coefficient of 0.2734, while DAVE vs DB spending gives 0.0049 and lastly the linebackers’ 0.0163. Defensive Line is the only one of the three position groups to show a significant correlation between spending at that position and defensive performance. Noting that the lowest DAVE value suggests the strongest defense, surprisingly, DBs show a slight negative relation between spending and defensive performance. This trend would suggest that paying veteran DBs large amounts of money may actually hurt a defense, with potential reasons being that those players are likely to miss time due to injury and may lose a step sooner. There has been vast amounts of research done to suggest that paying RBs large second contracts is detrimental to a team when considering opportunity cost; it is possible that the same is also true for the majority of defensive backs. However, given that the slope is just barely positive, that might be too hard of a stance to take. Nonetheless, defensive linemen seem to be contributing much more efficiently in relation to their contracts.
The linebackers chart has a low correlation as well, though still suggests a positive relationship between spending and defensive performance. However, it seems to imply that they are a somewhat expendable portion of the defense relative to linemen.
Taking all 3 position groups and attempting to determine value could involve using the slopes of the graphs to see how 10 million dollars would improve the defense. Remembering that a lower DAVE is better, calculating this linear value metric gives -.02840%/$10M for the defensive line, 0.00337 DAVE/$10M for defensive backs, and -0.00549/10M for linebackers.
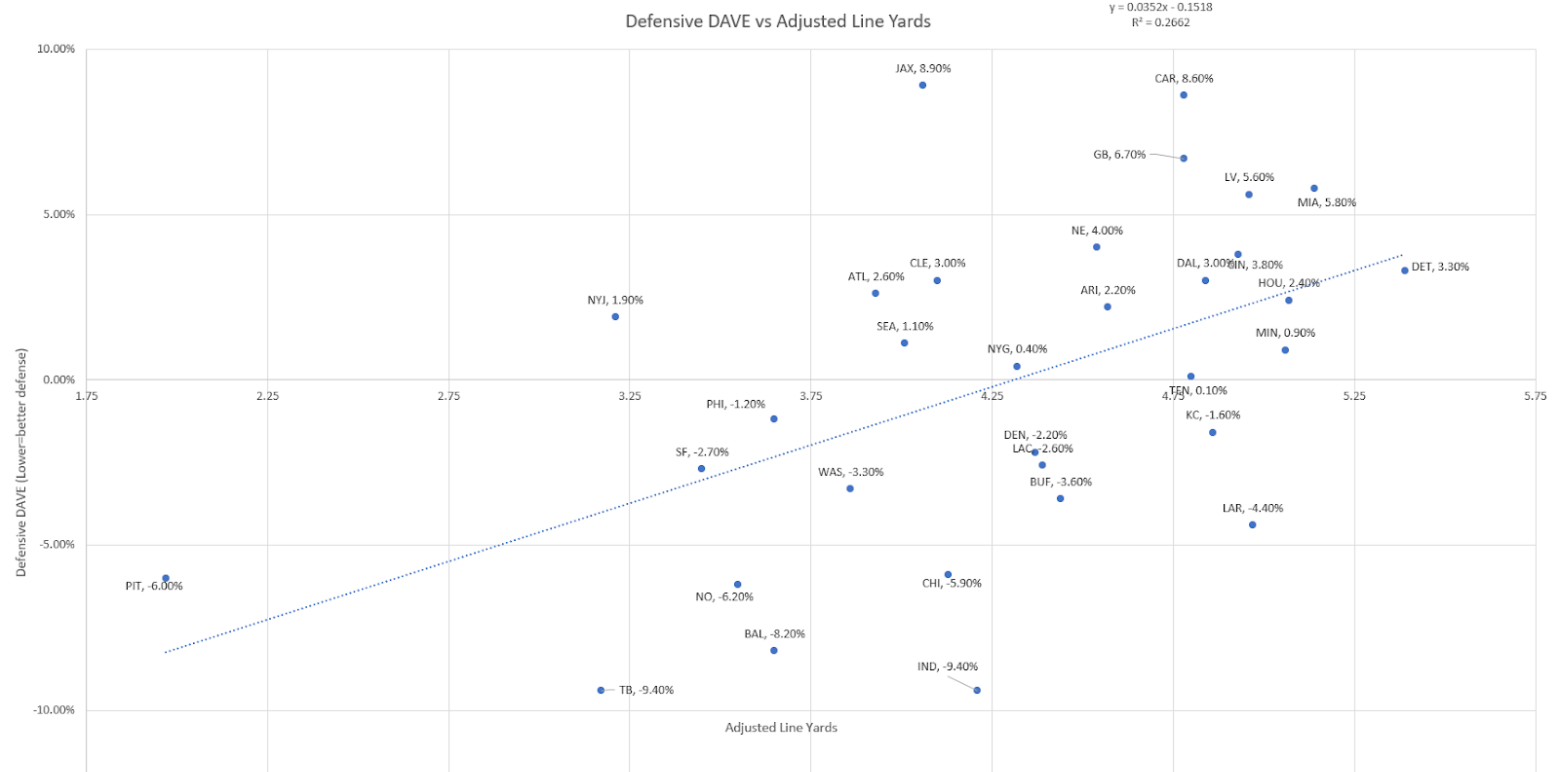
Finally, figure 4 serves to confirm the idea that Defensive DVOA is highly correlated to the Defensive Line performance, a proxy for which is Adjusted Line Yards - a metric that signifies the yards given up at the line of scrimmage by the defensive line. It correlates to both run defense and pass defense performance.
However, some may claim that rookie contracts could be a skewing factor in this analysis. Rookie contracts can certainly impact the calculations since rookie salaries are limited, for example, Jamal Adams significantly out produces his rookie contract. Furthermore, a defensive line like San Francisco’s would cost significantly more if they were on veteran contracts instead of rookie contracts. However, it is fair to not account for these cases because that merely corrects the positional costs for replaceability. For instance, it may be that cornerbacks still on their rookie contracts come in and do such a great job that paying a veteran is an inefficient use of funds, which could be what the analysis reflects. Not removing rookies shows that teams may not need to spend on big-ticket free agents at defensive back; instead they can rely on cheap veterans or rookie talent.
Similar to rookie contracts, others may suggest that injuries play a role in these findings. For example, a team could be spending large amounts of capital on an injured player as part of a position group could appear to be playing poorly, such as the case of Xavien Howard missing the majority of last year as one of the highest paid CBs. In response to that, if a position group tends to be more frequently injured than another, that would merely be another reason to rely on cheap veterans and rookies so that you can afford to have solid depth at that oft injured position.
Ultimately, while rookie contracts, injuries, or perhaps even scheme differences may all explain some of the trends presented in this analysis, the final message remains the same regardless of cause. Spending on the defense should be largely focused on the defensive line and EDGE rushers. Veterans and premium talent at other positions along the defense is not nearly as associated with overall defensive success. Savvy general managers should look elsewhere than big-ticket free agent defensive backs to solve their defensive struggles. While there is no doubt that defensive backs are important to winning football games, what is clear is that cap space should not be allocated towards that position group with as much priority as the defensive line.