Save on the Bullpen
By CJ Lu Sing | March 28, 2022

It’s the seventh inning in a close ballgame at the end of the season. The home team is second place in their division and battling for a spot in the postseason. After six, strong innings, the home team’s starting pitcher begins to falter. He retires two batters but allows two others to advance into scoring position. His manager decides to go to the bullpen, and with the season on the line, the call is to a reliever that has pitched well in high-leverage situations before.
The reliever steps on the mound and rewards his manager’s confidence by shutting down the opponent’s offense. His performance completely switched the game’s momentum to favor the home team. At the end of the season, the high-profile reliever elects free agency in search of a lucrative contract. However, with many options available, teams must carefully evaluate the value of potential signings; they may realize hefty spending doesn’t guarantee superior bullpen performance.
Team Spending
.png)
Each of Major League Baseball’s thirty teams has a different approach to bullpen construction. In 2021, the Los Angeles Dodgers spent $43.9 million, more than any other team, on a star-studded bullpen that featured All-Stars Kenley Jensen and Blake Treinen. On the other end of the spectrum, the Baltimore Orioles spent less than $2 million on a bullpen that rotated constantly through rookies.
However, the Dodgers and other big-market teams generally spend more on payroll than small-market teams like the Orioles. One way to standardize the value a team places on its bullpen across the league is to examine the proportion of its total payroll spent on relief pitchers. On paper, the 2021 New York Mets valued their bullpen more than any other team after spending 21.23% of its team payroll on relief pitching. On the other hand, the Toronto Blue Jays spent only 1.79% of its team payroll on the bullpen.
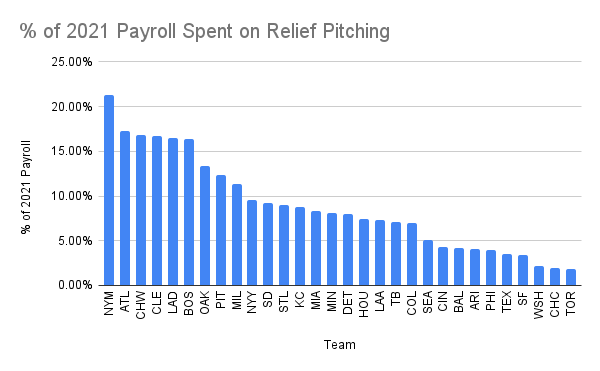
Among the top ten teams are traditional big spenders. However, a notable entry in the top ten is the notoriously frugal Oakland Athletics that placed a high value on their bullpen after allocating 13.37% of their team payroll to relievers.
Less than one-third of the league spent more than $20 million on their bullpen, and even fewer teams spent more than 10% of their payroll on relief pitching. Yet did high-spending teams like the Dodgers, Mets, and Braves outperform the teams that spent less on relief pitchers?
Team WPA
One reason it’s extremely difficult to quantify the value of MLB relief pitchers is that relief pitchers are inserted into either low- or high-leverage situations. When a reliever enters a close game, they are more likely to substantially alter the outcome of a game.
Win probability added (WPA) is one way to measure how a reliever’s contribution to team performance can affect the outcome. A team’s cumulative bullpen WPA should account for low- vs high-leverage contributions over a season. In theory, there is a positive correlation between spending and WPA because teams with higher spending should also have better pitchers contributing to overall bullpen WPA. Creating a scatter plot of team bullpen WPA versus team bullpen salary allows for clear visualization of this association.
.png)
The data somewhat supports the hypothesis that high-spending teams are rewarded with higher WPAs. However, the large residuals, or differences between observed and expected values, amongst the teams that spent less than $10 million indicate the suggested correlation is rather weak. This is further evidenced by the low R-squared value of 0.124.
%20(WPA).png)
Each MLB team’s residual indicates whether its bullpen outperformed or underperformed its expected WPA based on the team’s total spending on relief pitching. A positive residual indicates a team overachieved while negative values indicate the opposite.
The aforementioned Los Angeles Dodgers spent $43.9 million on their bullpen in the 2021 season, and they were rewarded with a bullpen WPA of 10.33, which was the highest in MLB. The Dodgers’ high residual indicates that they even outperformed their predicted WPA by 3.62 points.
However, there were three other teams that outperformed their predicted WPA more than the Dodgers. In 2021, the San Francisco Giants overachieved more than any other team with a positive residual of 7.99 points. The Giants had a 9.72 bullpen WPA in 2021, which was the second-highest in MLB, but they were not big spenders on relievers. Last season, the Giants spent $5.8 million on their bullpen, which was good for 20th place overall. The Seattle Mariners and Tampa Bay Rays had the next two highest residuals, and each spent less than $5.5 million on their bullpen. Meanwhile, the New York Mets, who spent $34.6 million on their bullpen exceeded their bullpen WPA expectations by 2.0462 points but were outperformed by thirteen other teams.
There are teams like the Arizona Diamondbacks, with a residual of -10.0768, that dramatically underperformed. However, the data ultimately suggests that front offices don’t have to sign costly relievers to find meaningful contributions.
Team SIERA
WPA often rewards more competitive teams. As they more frequently put talented relievers in high-leverage situations. Thus, a statistic like Skill-interactive Earned Run Average (SIERA) can be used to measure a pitcher’s general performance more objectively regardless of team.
SIERA quantifies pitcher performance similar to traditional statistics like earned run average (ERA), but it eliminates factors, like base hits, that a pitcher cannot control. Instead, it takes into account the three true outcomes and features like how hard and where a ball is hit. A lower SIERA is preferable, and in theory, teams that spend the most money should have the bullpens with the lowest SIERA. Similar to bullpen WPA, creating a scatter plot of team bullpen WPA versus team bullpen salary allows for a visualization of this association.
.png)
Again, the data supports the hypothesized correlation. However, there is variation, demonstrated by sizable residuals, which challenges the association’s strength. The most successful teams outperform their projections with lower than expected bullpen SIERAs.
%20(SIERA).png)
In 2021, the Tampa Bay Rays outperformed their projected bullpen SIERA the most. Their 3.59 bullpen SIERA was 0.5131 points lower than their predicted 4.10 bullpen SIERA. The Rays, who spent $5 million on their 2021 bullpen, again demonstrate that teams that spend less on their bullpen can have great success. Out of the top ten teams that outperformed their projections the most, seven of them spent less than $10 million on relief pitching.
The Players
Historically, teams that underperformed would have sought to improve their bullpen by spending a lot on established veterans that provided decent production. However, after examining the relationship between salary and an individual reliever’s SIERA, teams may save on the bullpen by pursuing pitchers that exceed expectations.
In theory, pitchers that earn the most money should have the lowest SIERAs. Creating a scatter plot of player SIERA versus salary provides a visualization of this association. This scatter plot uses data from 72 MLB relievers with more than 30 innings pitched and available salary data.
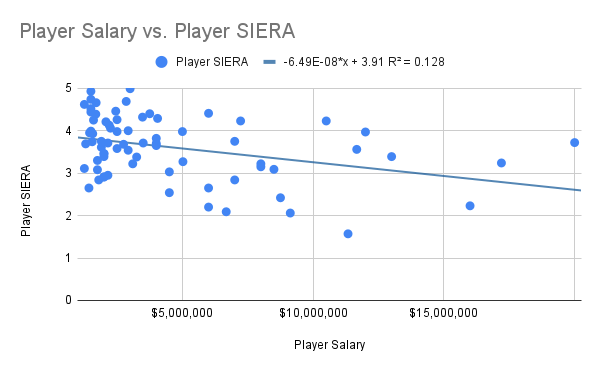
Similar to the previous two visualizations, there is significant variation and many players had SIERAs far from their projections based on salary.
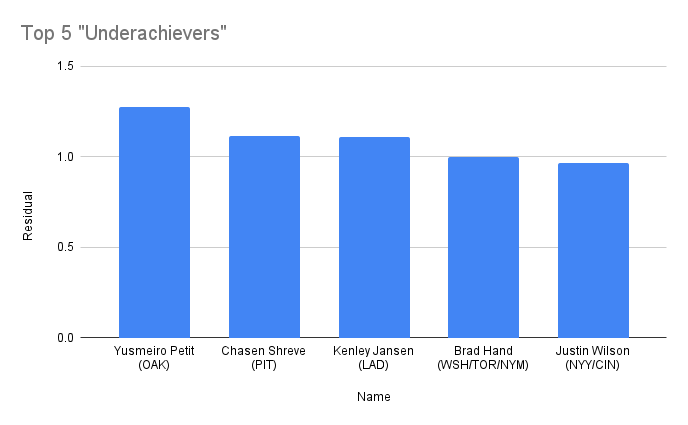
The five pitchers with the greatest positive difference between their actual SIERA and their projections were Yusmeiro Petit, Chasen Shreve, Kenley Jansen, Brad Hand, and Justin Wilson. In 2021, Hand earned $10.5 million, which would have required him to pitch to a 3.23 SIERA to meet expectations. However, with a 4.23 SIERA, Hand clearly underperformed. His peer in the top five, Kenley Jensen, is an interesting case because he pitched to a respectable 3.72 SIERA. However, his $20 million salary meant he should have pitched to a 2.61 SIERA. These pitchers made the case that they were “overpaid.”
On the other hand, there were pitchers that made the case they were “underpaid” based on their 2021 performance.
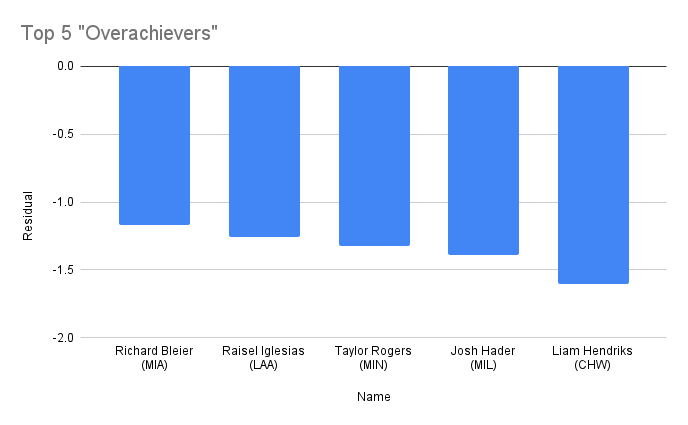
Liam Hendriks, Josh Hader, and Raisel Iglesias are dominant closers that are respected around the league. In 2021, Hendriks had an astonishing 1.57 SIERA, which was by far the lowest and only sub-2 SIERA in the sample. However, each of these pitchers still overachieved their “value” as relievers by more than one point of SIERA.
Many teams already recognize these relievers’ value, and the top four “overachievers” were far from inexpensive. Each made at least $6 million last season. However, in fifth place, Richard Bleier of the Miami Marlins emerged as a diamond in the rough for the Miami Marlins with a 2.65 SIERA, which exceeded expectations by more than one point of SIERA. Bleier earned $1.425 million, and based on his 2021 achievements, he was significantly underpaid.
Conclusion
MLB teams have varying approaches to bullpen management, but each team’s bullpen construction could be improved by examining how relievers performed relative to expectations. If underachieving teams spent more judiciously on relief pitching, they should be able to meet their expectations and possibly even surpass them.
The free agent market should seek to reward players that exceed expectations. Teams that target these pitchers should be positioned to benefit from improved bullpens. Their front offices will consequently build bullpens geared towards winning while simultaneously saving on the bullpen.