The Value of Winning
By Alon Tamir | March 28, 2022

If there’s one constant in sports in the era of massive TV rights deals it’s this: the values of teams go up, practically always. But by how much, and does performance have a serious impact on the change in value of a team? In this article, I will try to parse out how much regular season success affects the change in a team’s value. I will be looking at the time period from 2012 to just before the pandemic, 2019, as I don’t want the strangeness of the pandemic and its effects to warp our data. I will also be using Forbes’ estimate for what these franchises are worth, so while it may not be perfect, it should be a fairly good proxy for the actual franchise values.
NFL
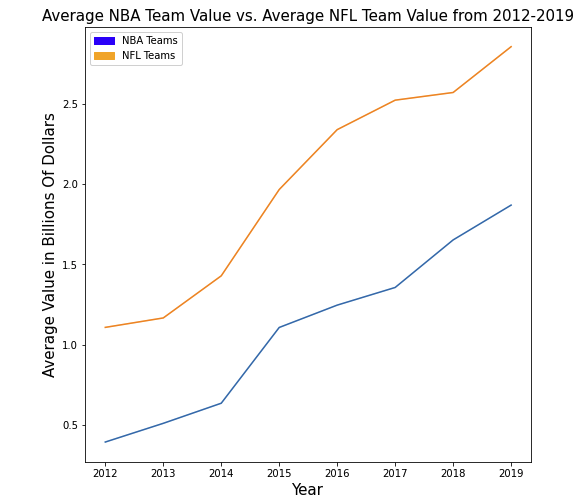
Owners of NFL teams have had a lot to be happy about this past decade, as they have seen their investments rocket up in value. Below is a graph of the average NFL team value from 2012 to 2019. As you can see the values of NFL teams have risen dramatically in the past couple of years,
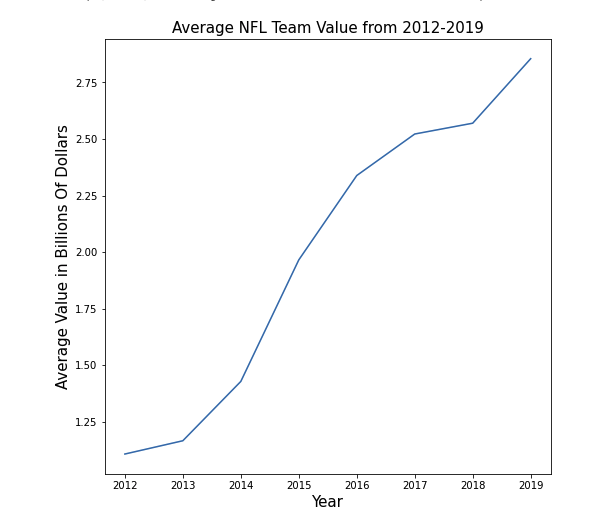 from an average value of $1.1 billion in 2012 to an average value of $2.86 billion in 2019. With values of teams rising so quickly, it begs the question, does it matter how well one’s team does? To examine this, we can look at regular season winning percentages for teams from 2011-2018 and see the corresponding % change in their value the following year. Below is a graph that is plotting exactly that relationship, and as we can see there seems to be no correlation at all.
To further assess the correlation between the two variables, we can look at the r-squared value between these two variables, which in this case is .026. What that number is telling us is that 2.6% of the variation in % change in team values can be attributed to team performance. Basically, team performance has little to no effect on the percent change in team value the following year in the NFL.
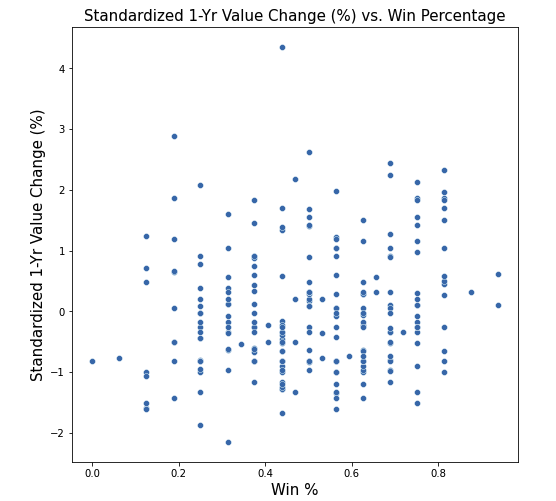 Could this be part of the reason we see negligent owners who seem to care very little about the performance of their team, knowing their investment will continue to climb in value anyway? One thing to note is that I put all of the percent change in values in standard units, meaning the % change in a value a team experienced is taken relative to how values across the league changed that year. For instance, if the Houston Texans had their value increase by 4% but the average increase in value that year across the league was 7%, then their standardized % change in value would be negative.
Something we should consider is that teams may not see their success reflected in their franchise value for a couple years, so we can look at the values of teams who consistently won vs. those who lost more than they won. Below is a graph plotting the franchise values of teams who were at or above a 50% win rate from during our selected time period vs. values of teams who weren’t.
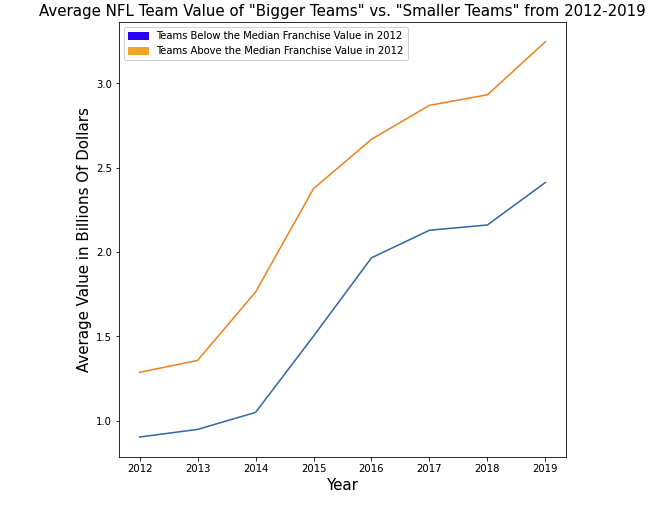
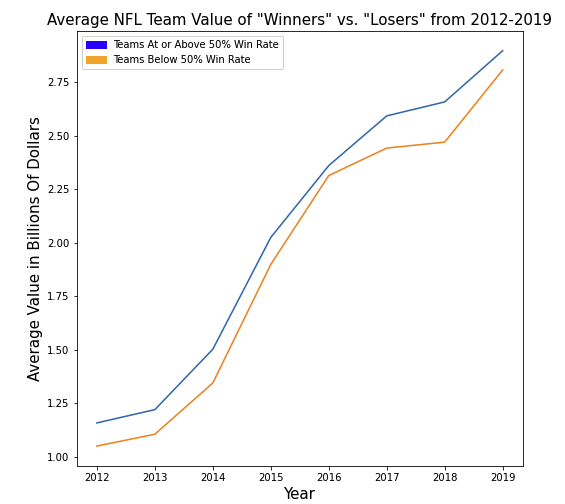 As we can see, there isn’t a big difference in the pattern of how franchise values changed for the more successful teams vs. the less successful ones. The teams that won more often than not seemed to be seeing their success pay off in the middle of our selected time period, however the less successful teams recovered nearly all the difference in franchise values by 2019. We can also examine whether teams that were more valuable in 2012 saw their values increase more rapidly than the teams that were less valuable in 2012. Below is a graph plotting the franchise values of teams who were above the median franchise value in 2012 vs. the values of teams that weren’t. Again, we see that the pattern of value increase is fairly similar between our two selected groups.
NBA
We now can move to the NBA, where we will see if regular season success has more of an effect on the change in franchise values than it does in the NFL. To give some context of how NBA teams have seen their franchise values increase, I will plot them below in comparison to the average value of NFL franchises over the years. The NBA has seen the average value of its franchises rise from $0.4 billion in 2012 to $1.87 billion in 2019.
 If we look at a plot of standardized 1-year franchise value % change vs. Win %, we see that a strong correlation is not present. In fact, the r-squared value for these two variables is 0.073, which is a higher correlation than we saw for the NFL, but it’s still a fairly weak one.
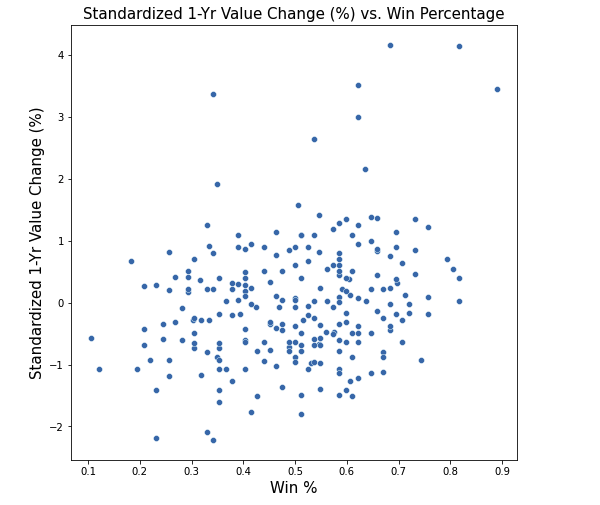
Where we see the highest correlation is when we compare the percent growth teams saw in the value of their franchise vs. the size of their nearest media market.
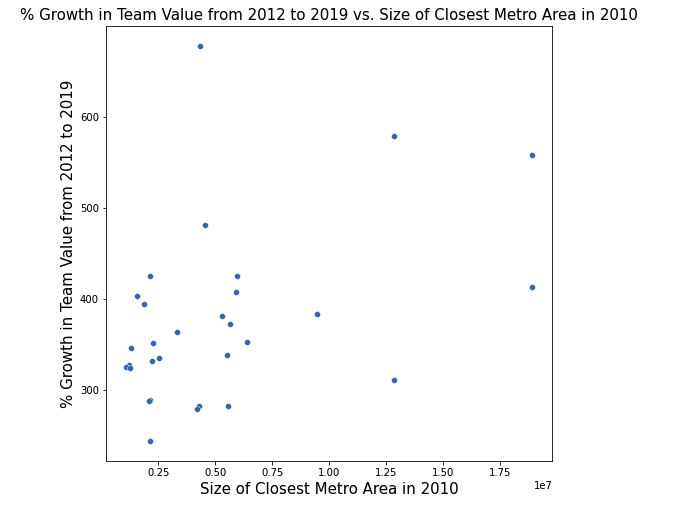
As we can see, there seems to be a correlation between media market size and growth in franchise value. This is backed up by the fact that the r-squared value of these variables is 0.18, a considerably higher correlation compared to the values we’ve calculated so far. If we plot out the average values of teams in bigger markets vs. those in smaller ones over the years, we get the following graph. Clearly, teams in bigger markets have had a more prosperous decade compared to their smaller market counterparts who have struggled to grow in the same manner that the bigger market teams have.

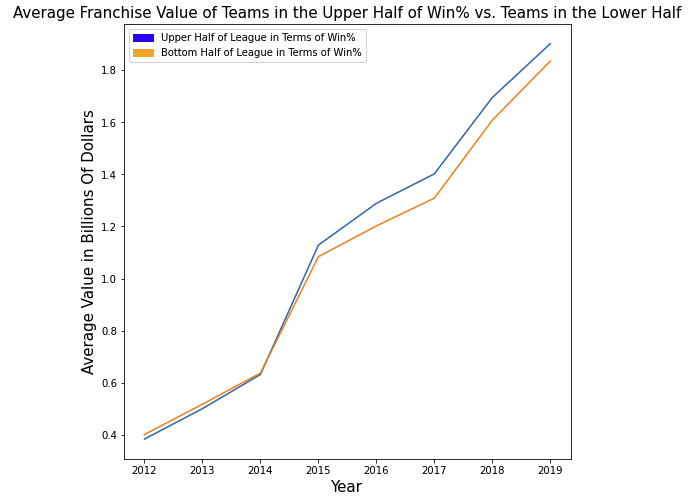
This makes sense when we take a more granular look at the data, as two teams that saw the biggest percent growth in their franchise value were the Golden State Warriors and the Los Angeles Clippers, two teams in sizable markets who created momentum for themselves by finding success on the court. Speaking of team success, below is a plot of the average value of teams that were in the top half of the league in terms of Win% from 2012-2019 vs. the teams that were in the bottom half. As we can see, the average values were nearly identical at the beginning of the decade, but the more successful teams saw their franchises gain in value a bit quicker towards the end of our time period when compared to their less successful counterparts.
Perhaps NBA fans of basement dwelling teams with negligent owners can glean some hope from this article that without providing the infrastructure to see success on the court, owners may feel the consequences of their dereliction of duty in their pocketbooks.