Bracket Hack-it: Statistical Guide to March Madness
By Jaredan Levin | March 20, 2019
It’s that time of year again. Upsets, bracket busters, and buzzer beaters galore. I’m sure all of you are busy filling out your brackets before the Thursday morning deadline but please be sure to participate in SAGB’s bracket challenge to give yourself a chance to win big. But that is the age-old question, isn’t it? How does one possibly hope to increase the chances that their relatively arbitrary picks will come to fruition?
Well, whether you are a college basketball fan or not, I have prepared some brackets for you to see how the 2019 NCAA Tournament field stacks up in single-statistic contests. Please note that the data comes from teamrankings.com and ESPN.com and that the total points tiebreaker in the championship game is the two teams’ average points per game combined and rounded to the nearest whole number.
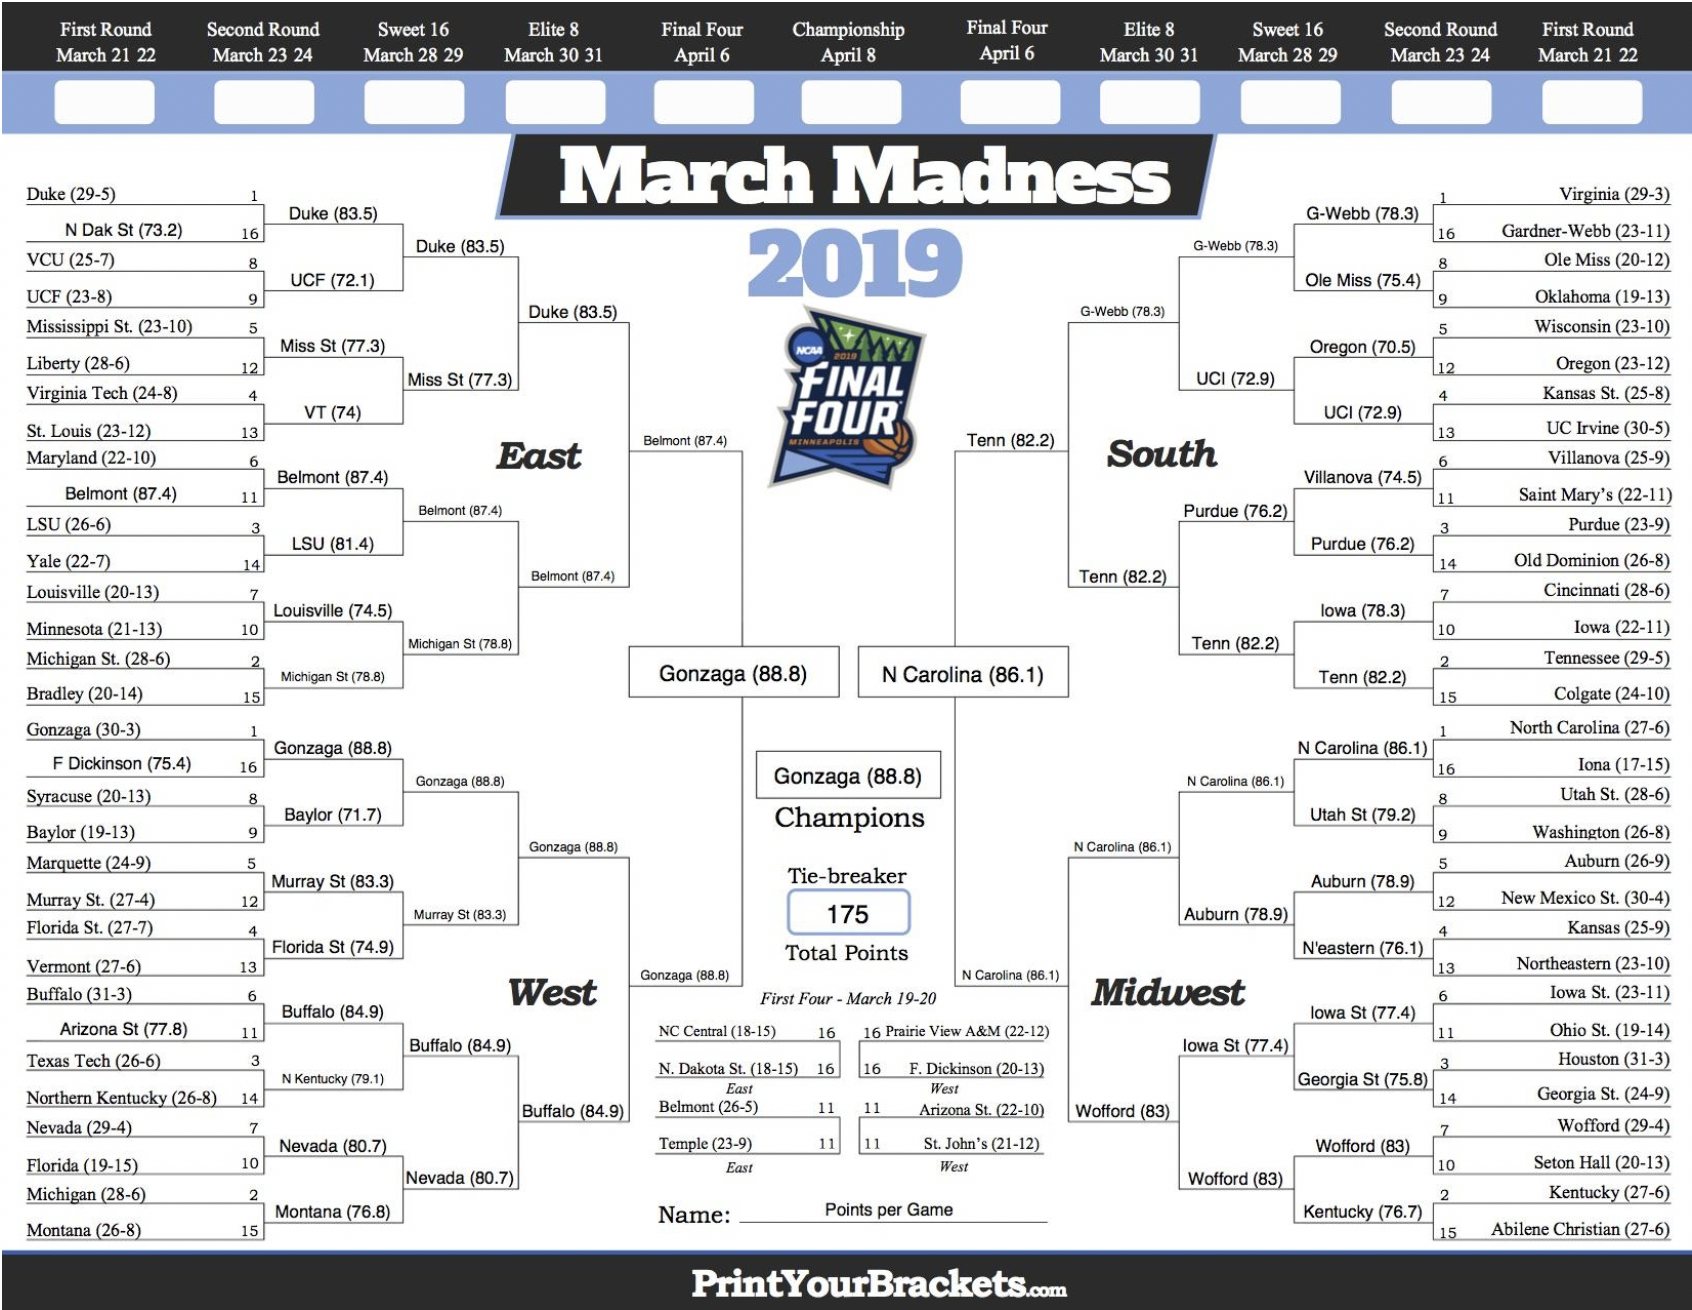
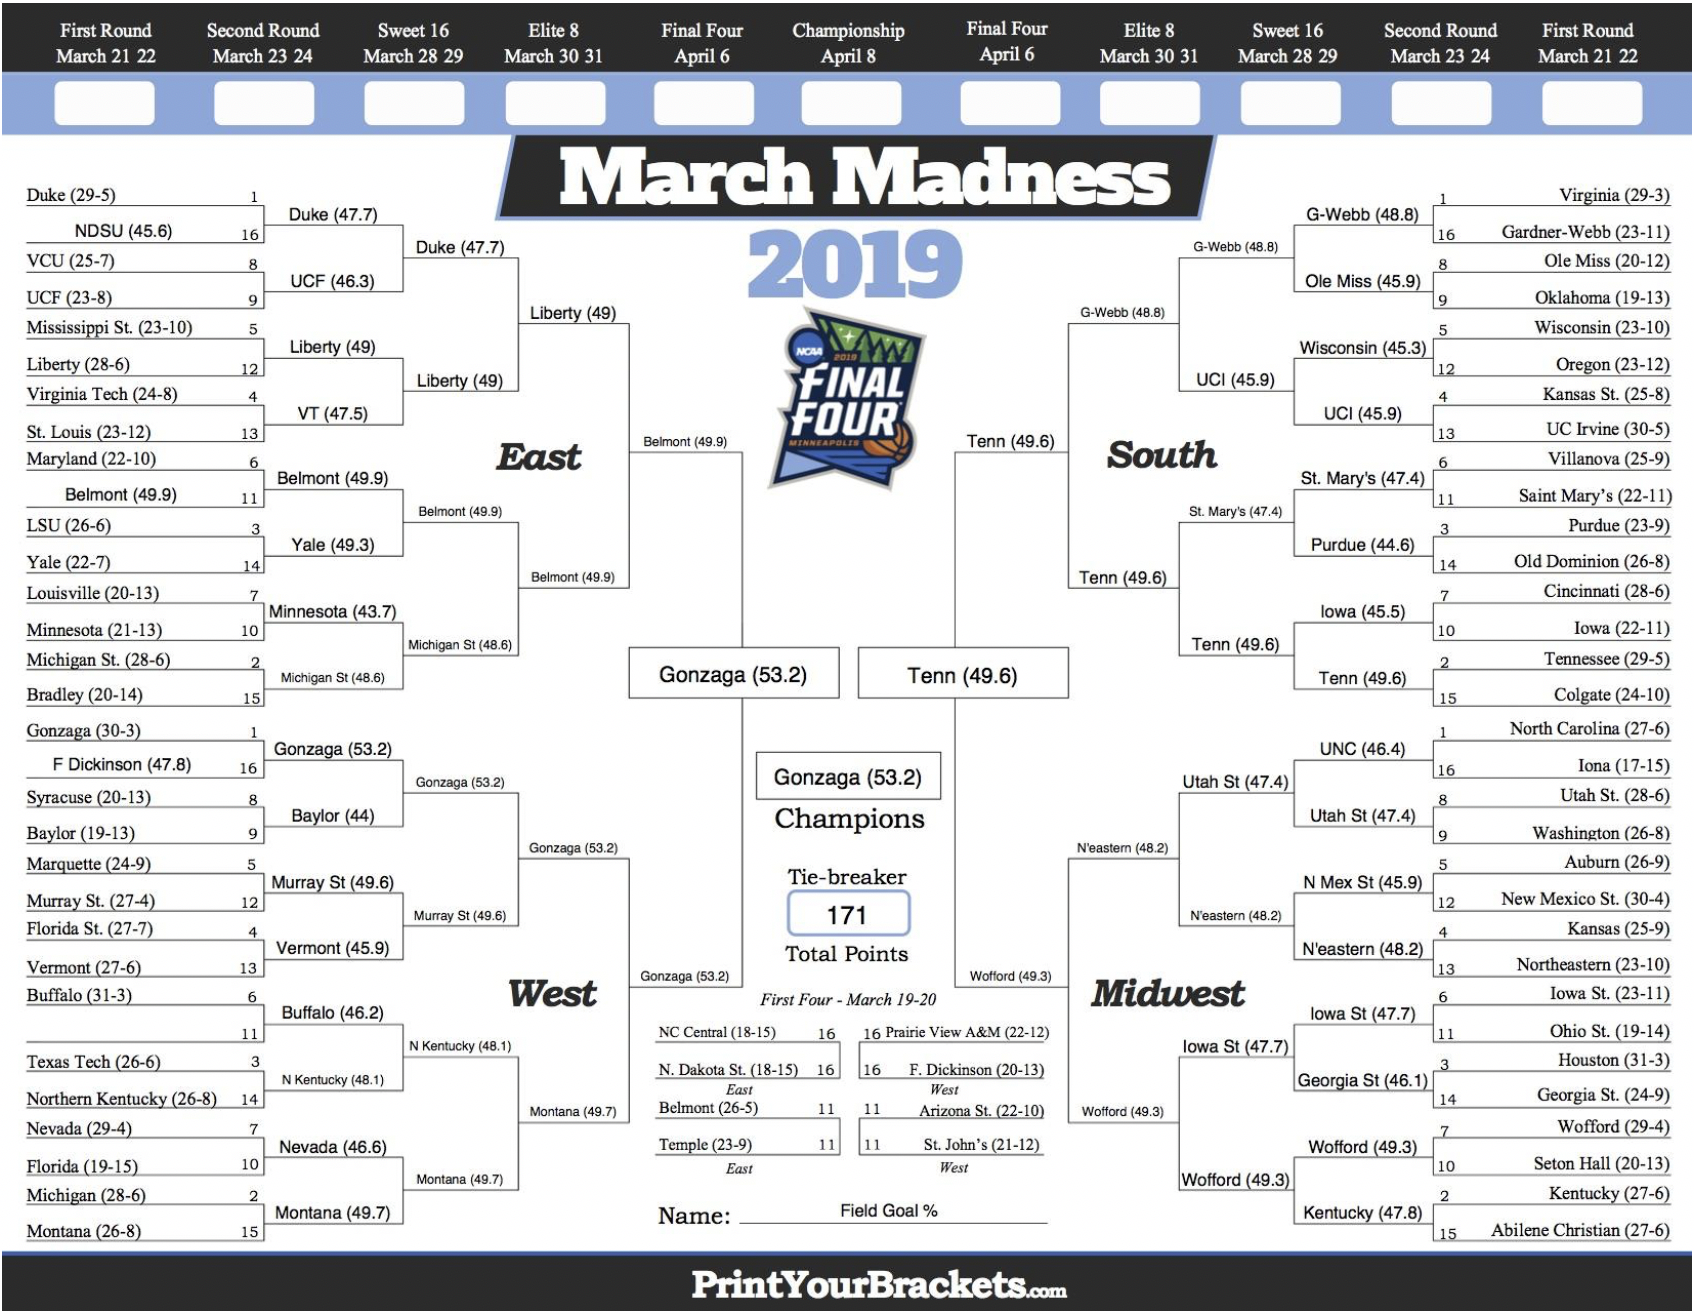
That brings me to the first bracket, points per game (listed in parentheses). The champions of this bracket are the Gonzaga Bulldogs who not only lead the tourney field in scoring per contest but also the entire NCAA. Led by future NBA player Rui Hachimura, the Zags will be a tough out and if you like scoring, this is your pick to win it all.
Much can be said about which team scores better but many fans are just as likely to ponder a team’s defensive ability. The next bracket outlines which teams hold their opponents to the fewest points per game.
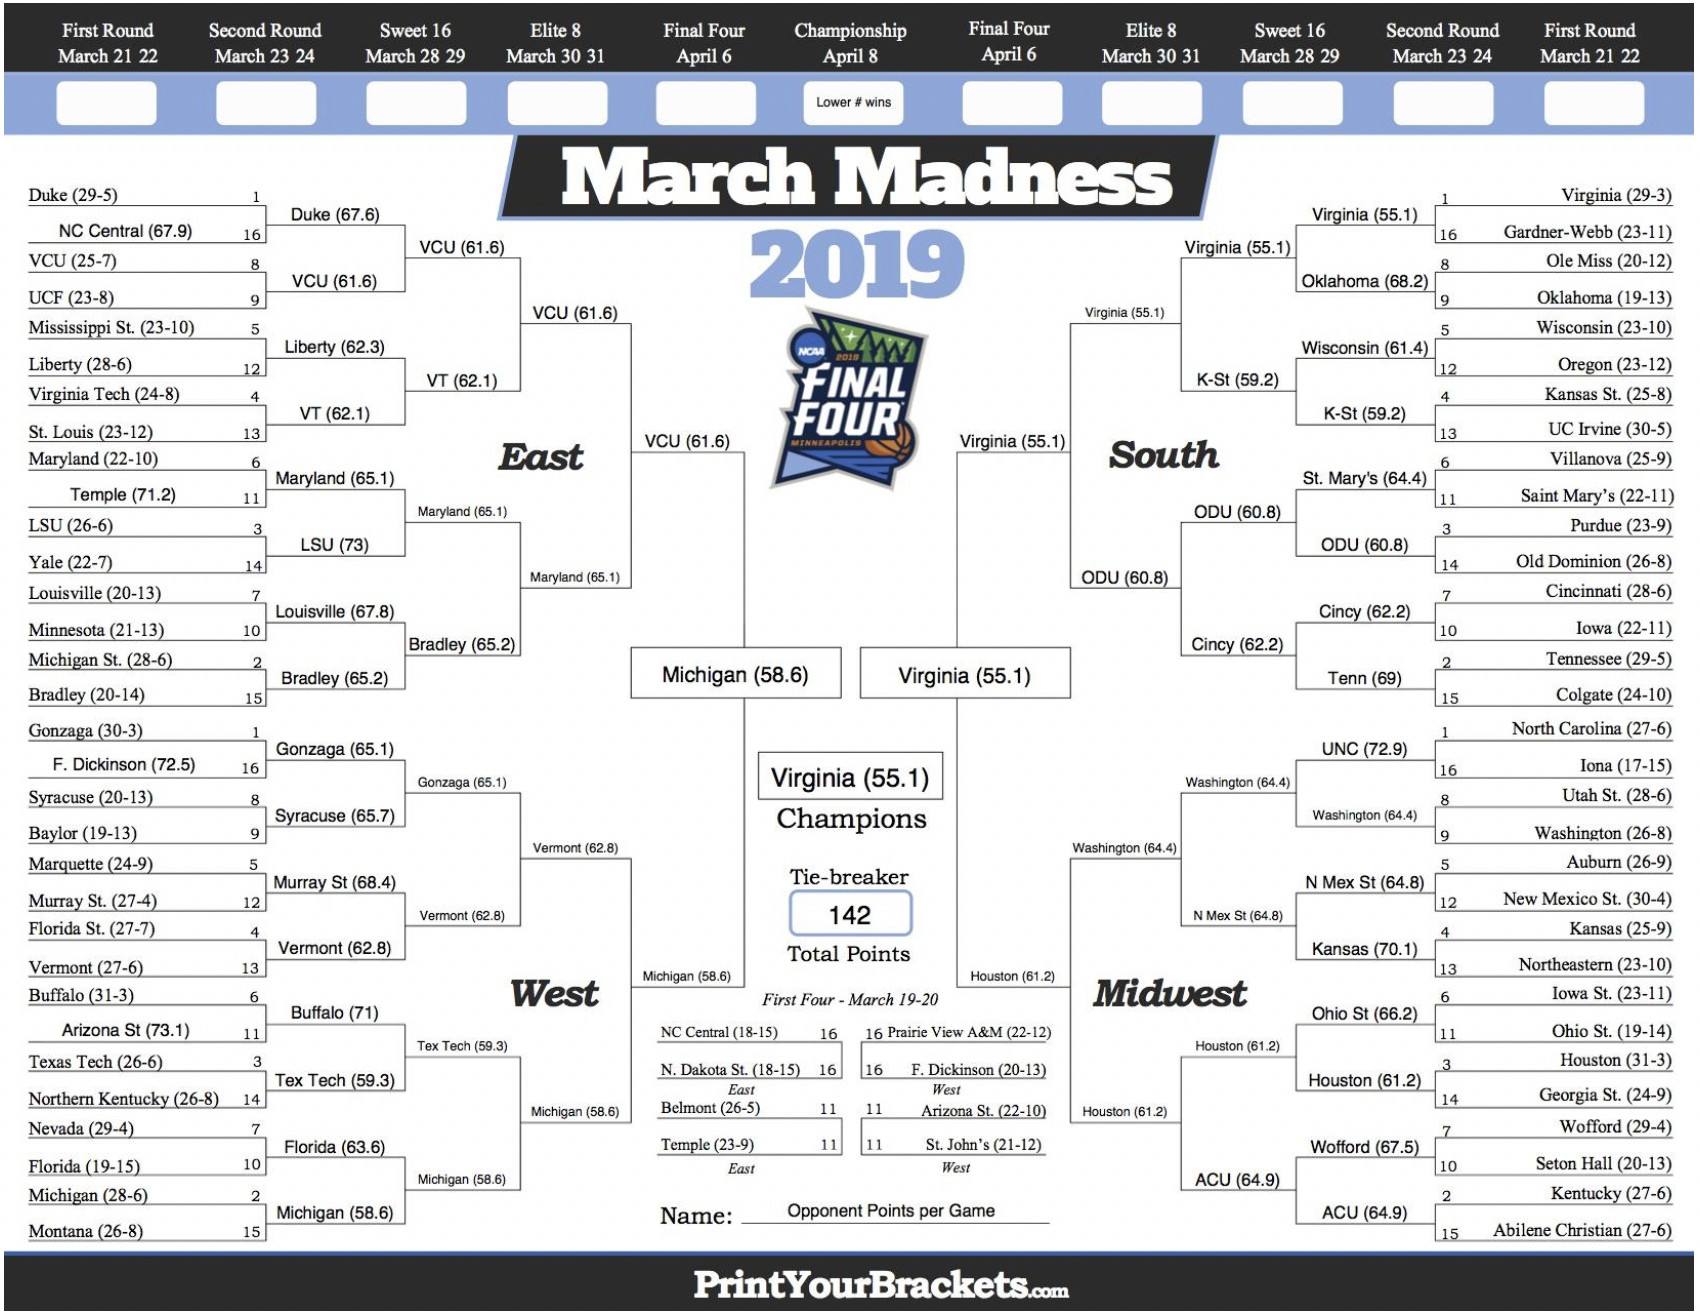
The champion here is the Virginia Cavaliers. The Wahoos stifle their opponents to only 55.1 points per game, anchored by another future NBA player, De’Andre Hunter. If you enjoy watching lockdown defense on every possession, Virginia is the pick for you.
March Madness often results in close games, meaning that the teams are quite evenly matched. Oftentimes, such contests come down to which team can convert at the line at a higher rate, particularly in the clutch. The following bracket outlines which teams are the more accurate free throw shooters.
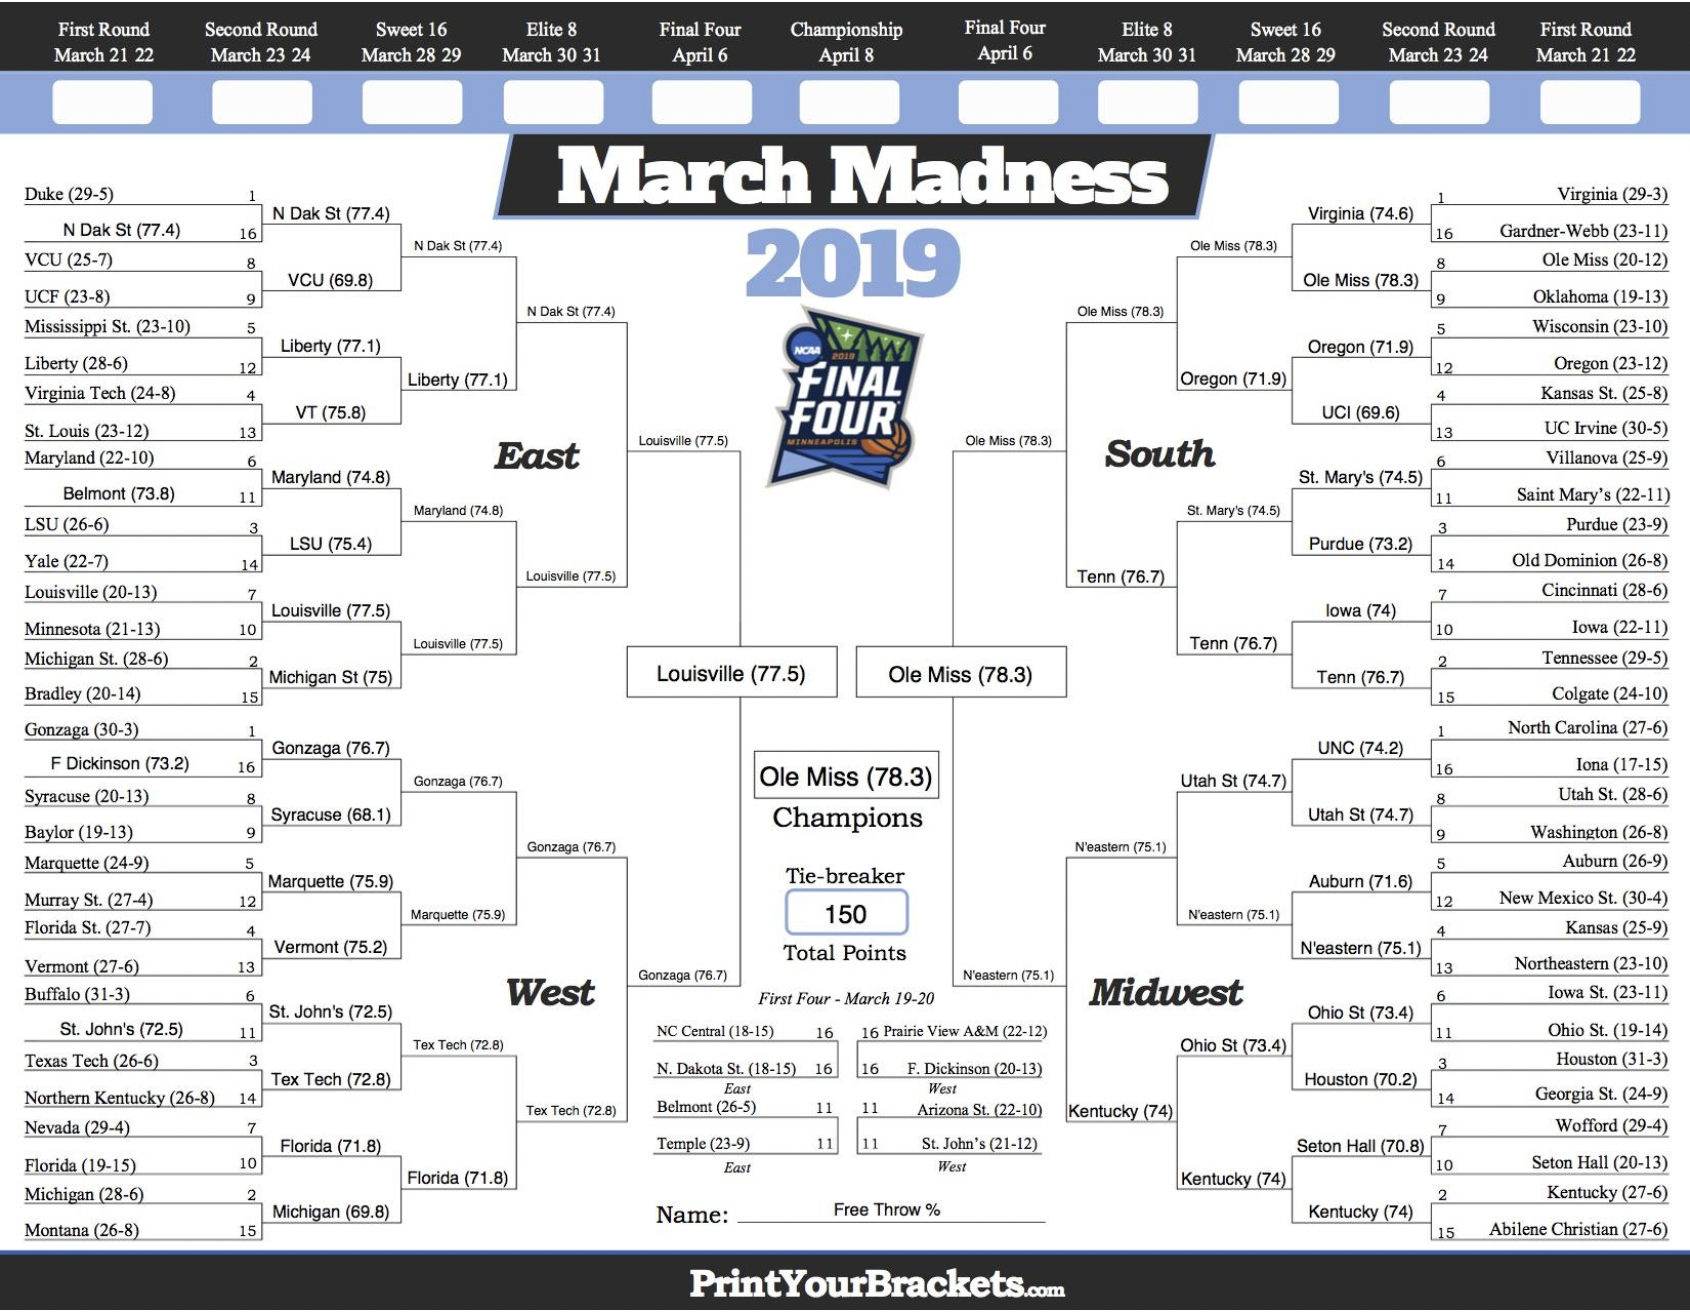
The Rebels of Ole Miss take the crown in the free throw percentage bracket. They make their shots at the charity stripe at a 78.3% clip, good for fifth in the nation and the best in the tournament field.
Accurate shooting percentages are often what distinguishes a good team from a great one. You would hope that that your championship pick would shoot a good percentage from the field, no? In this next bracket, you’ll get a look at how the 68 teams stack up in field goal percentage.
Gonzaga wins out again. The Bulldogs shoot an astounding 53.2% from the field. Making more than half of your shots night in and night out is a scary sight. While one could argue that this is because the defenses Gonzaga faces in the WCC are not as strong as other conferences, it has still been a more than impressive season for Spokane’s team. If accuracy is your thing, the Gonzaga pick is for you and hey, it certainly doesn’t hurt that they also lead the nation in points per game.
There is always balance in the world. What goes up must come down and the yin & yang of basketball is that teams must play both offense and defense. We have seen NCAA best Virginia in preventing points on the board win a bracket thus far and now we will take a look at who prevents accuracy the best in the opponent field goal percentage bracket.
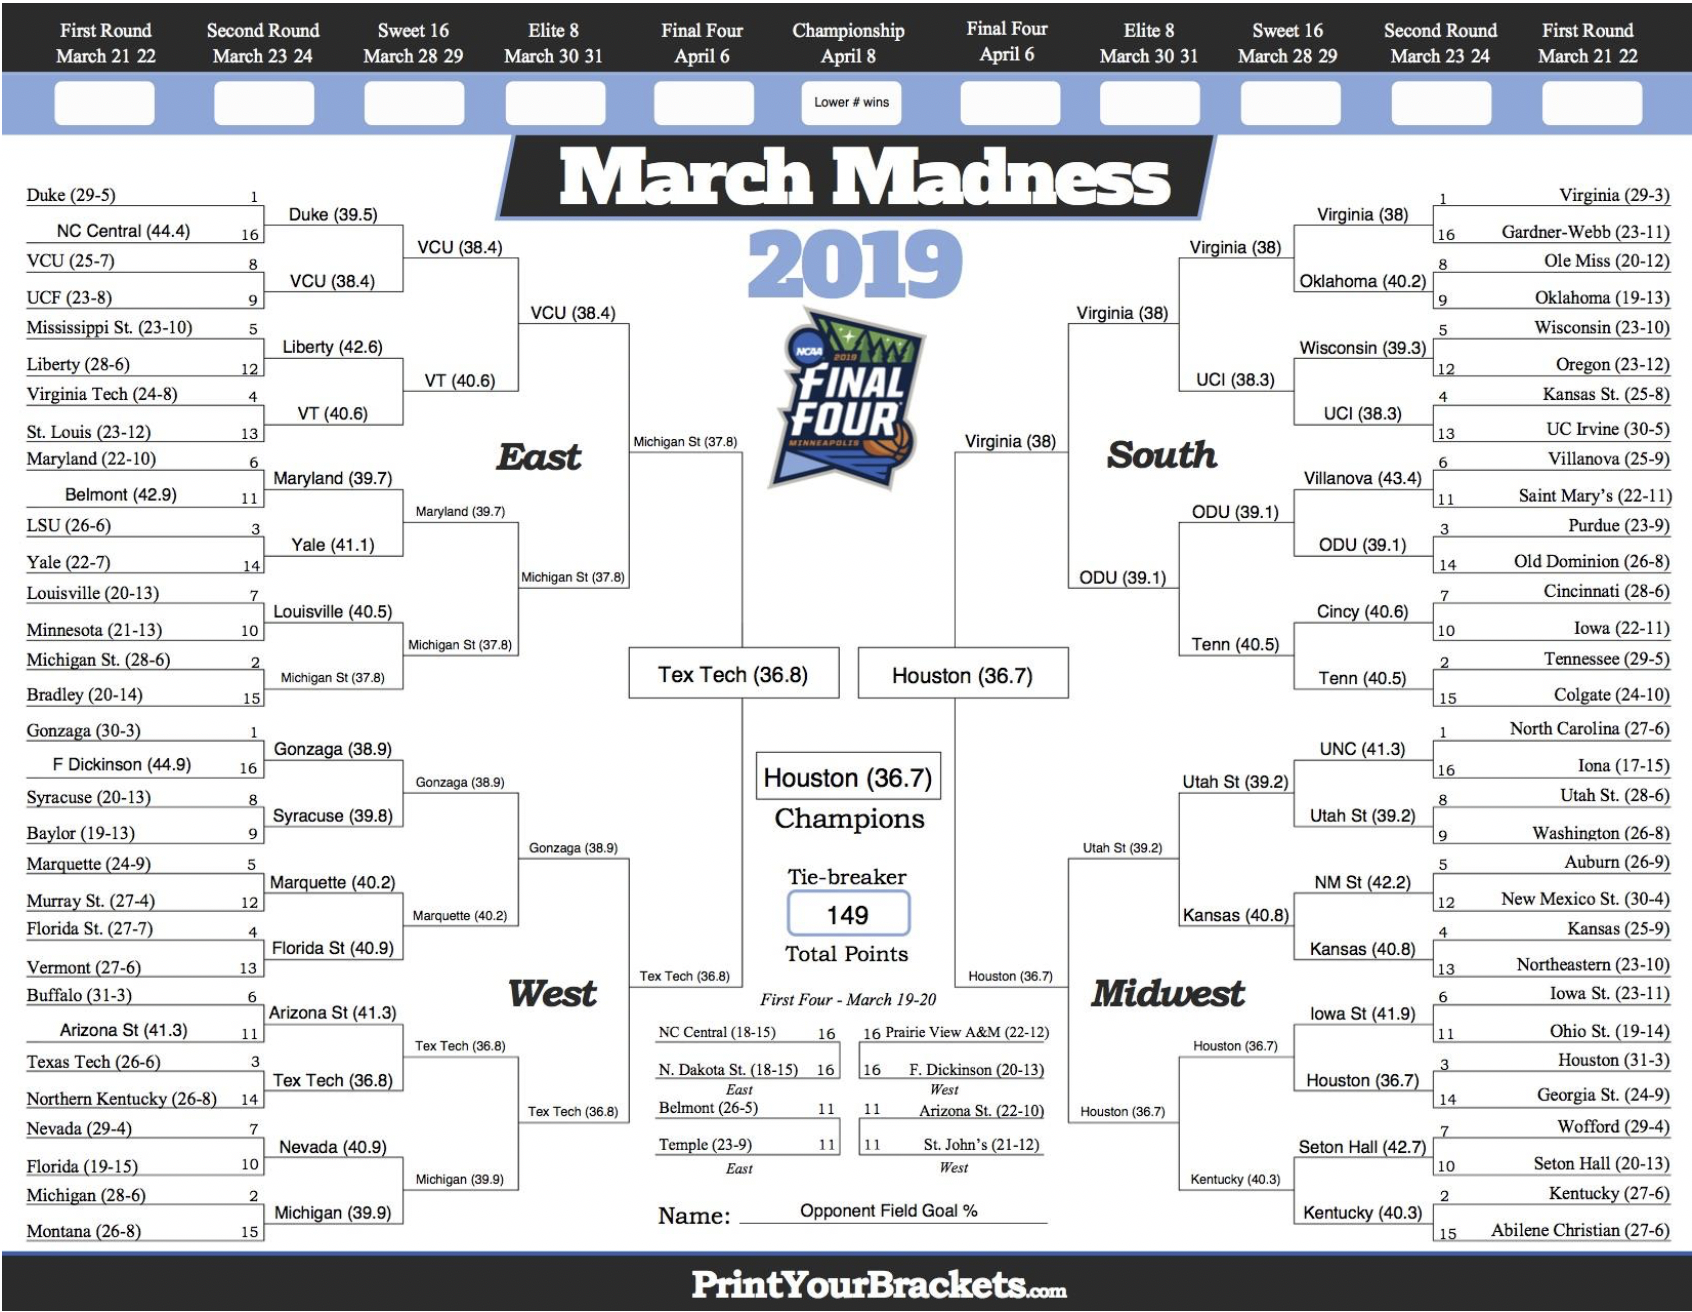
The Houston Cougars are the champs here, holding opponents to just 36.7% from the field. This is a deep, physical team not afraid to foul to impose their will on opponents. Also be sure to keep an eye on the Red Raiders of Texas Tech, who trail by only 0.1%.
Basketball is an evolving game and what fans and bracketologists these days alike adore is three-point shooting. Take a look at how the field of 68 stacks up in shooting the long ball.
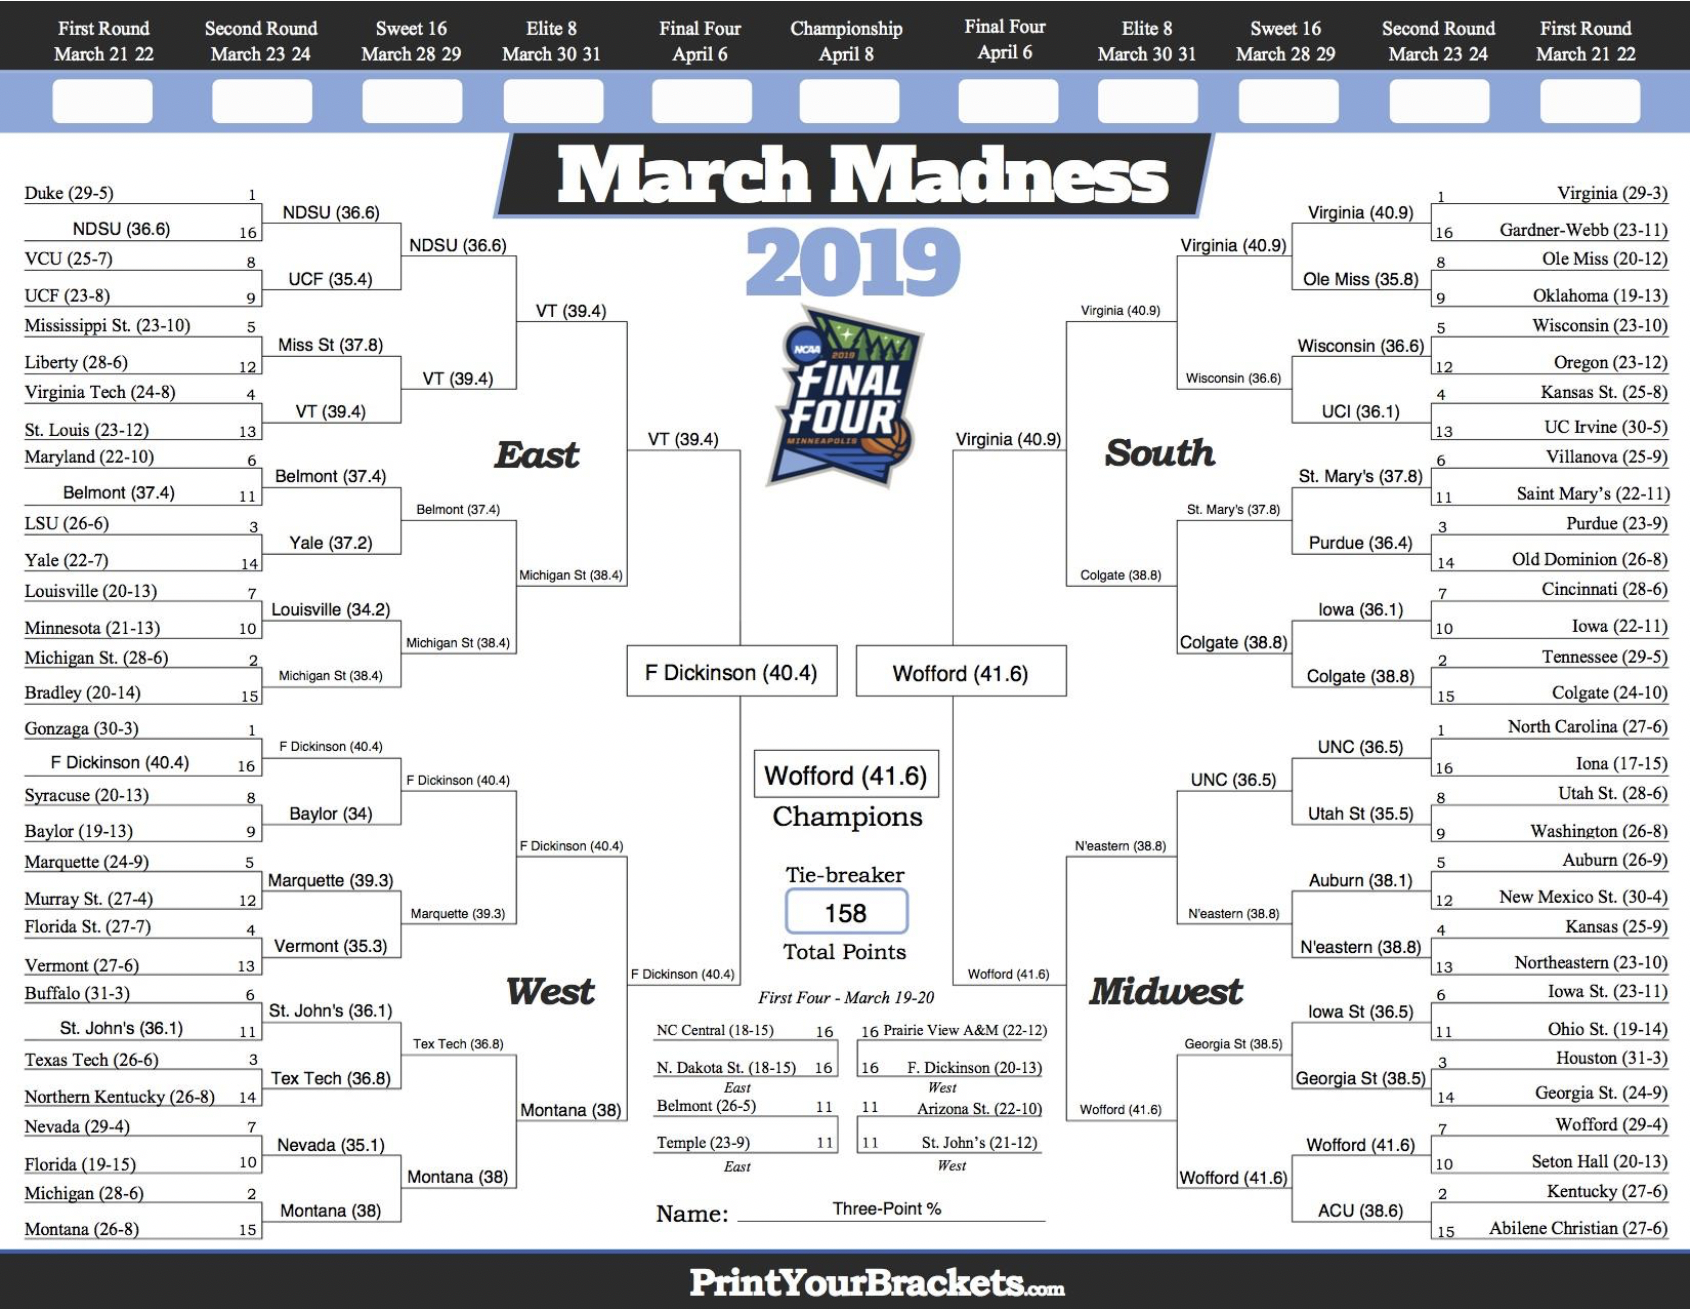
The first mid-major winner of this article is the Wofford Terriers out of the SoCon. They a shoot lights out 41.6%, led by guard Fletcher Magee, who I saw play firsthand in the 2017-18 season when Wofford made the trip to Haas Pavilion. He can shoot with merely an inch of space and loves coming off of screens to fire off a shot without even needing his feet set. Notably, the Duke Blue Devils are the worst three-point shooting team in this tournament at 30.1% and should they win a title, they will be the worst three-point percentage team to do so. That being said, Wofford is an exciting team sure to please the three-point enthusiasts making this pick.
Most college basketball fans will agree–there is a certain satisfaction with seeing the ball go in the basket. But most of those jaw-dropping dunks, long-distance threes, and quick dump-offs would not be possible without a good assist. Here is the bracket for assists per game.
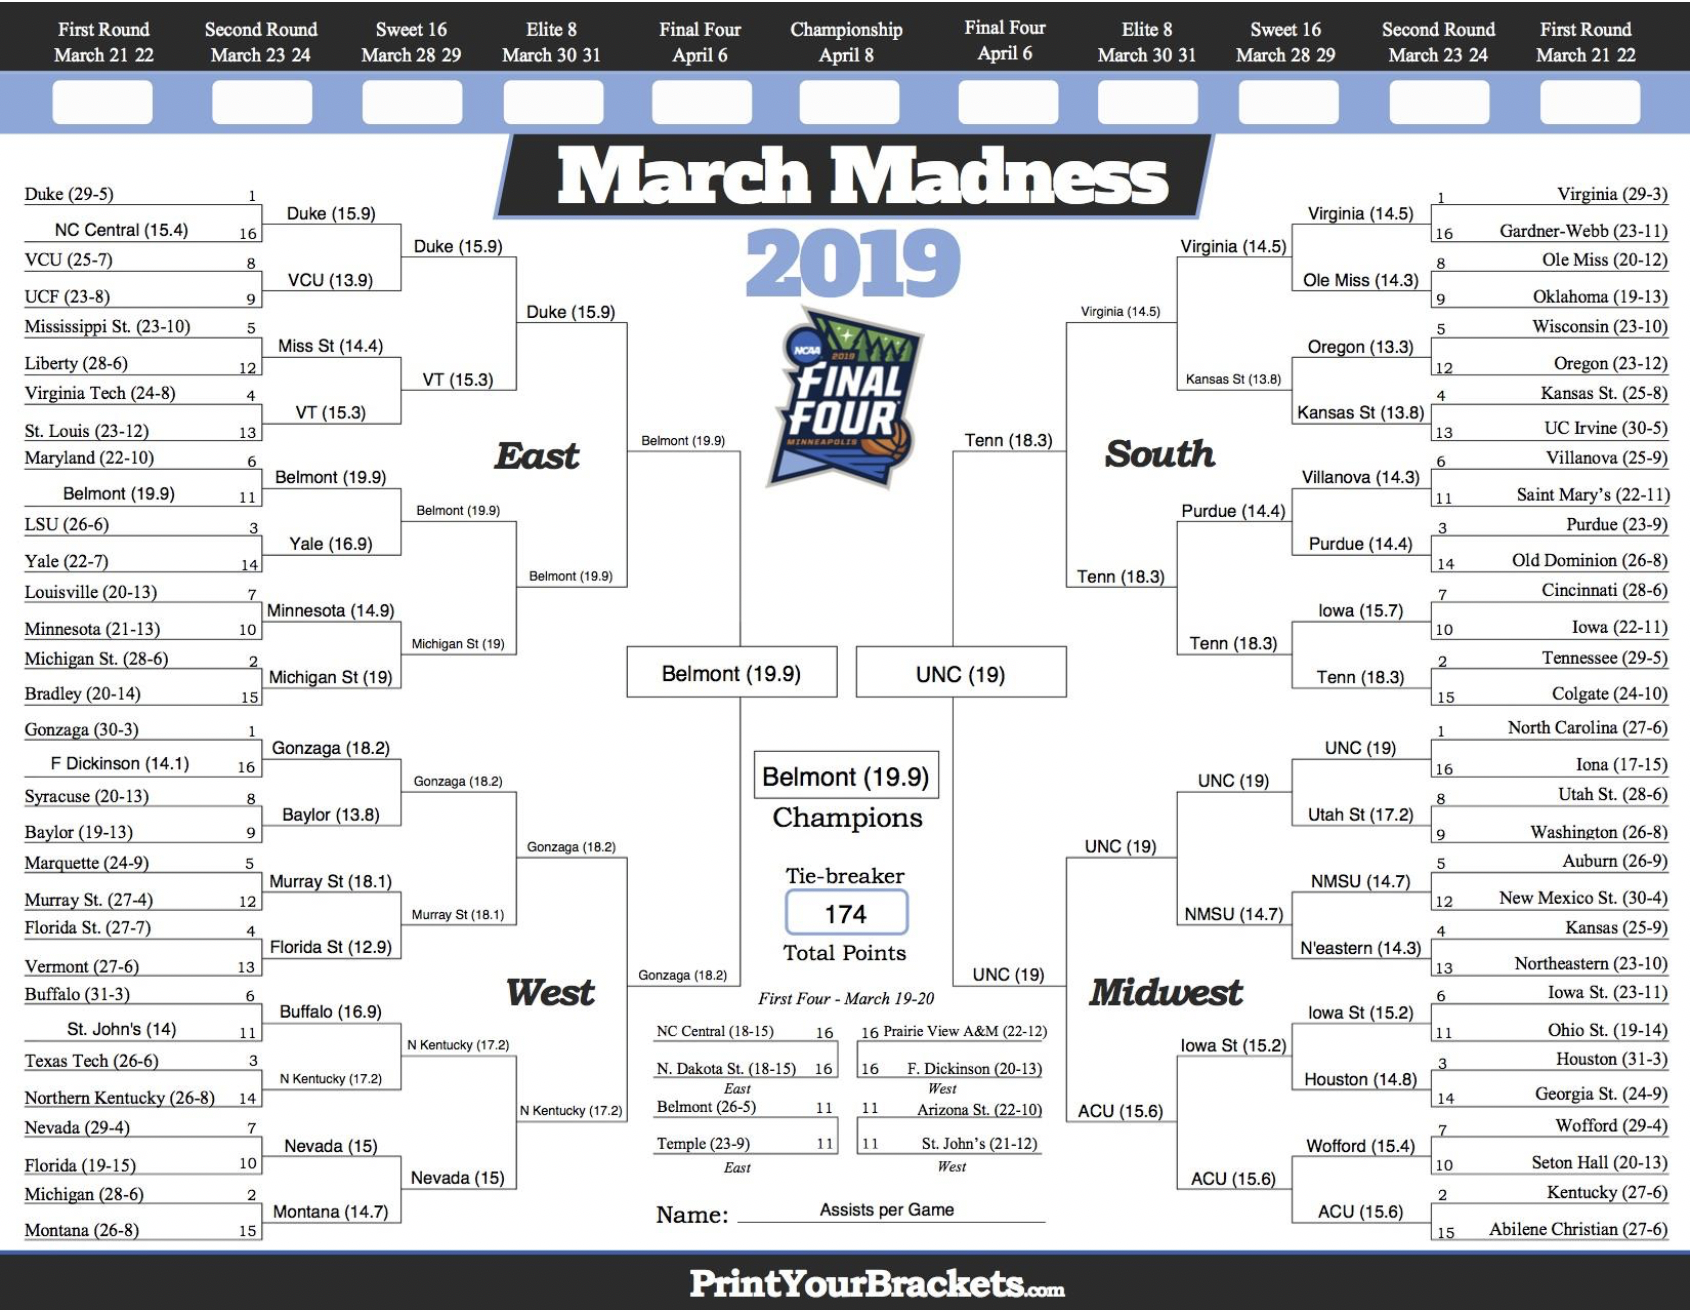
The champions here are another mid-major in the Belmont Bruins. Coach Rick Byrd and star swiss army knife Dylan Windler lead the OVC-regular season champs into the First Four on the first day of March Madness. Also important to note is their conference-mate Murray St. features Ja Morant, the nation’s leading assist man at 10 per contest.
One of the more overlooked aspects of the game is rebounding, whether it is defensive to prevent the opponent from getting another shot or offensive to continue the possession. Oftentimes, winning the rebounding battle is key to winning the game.
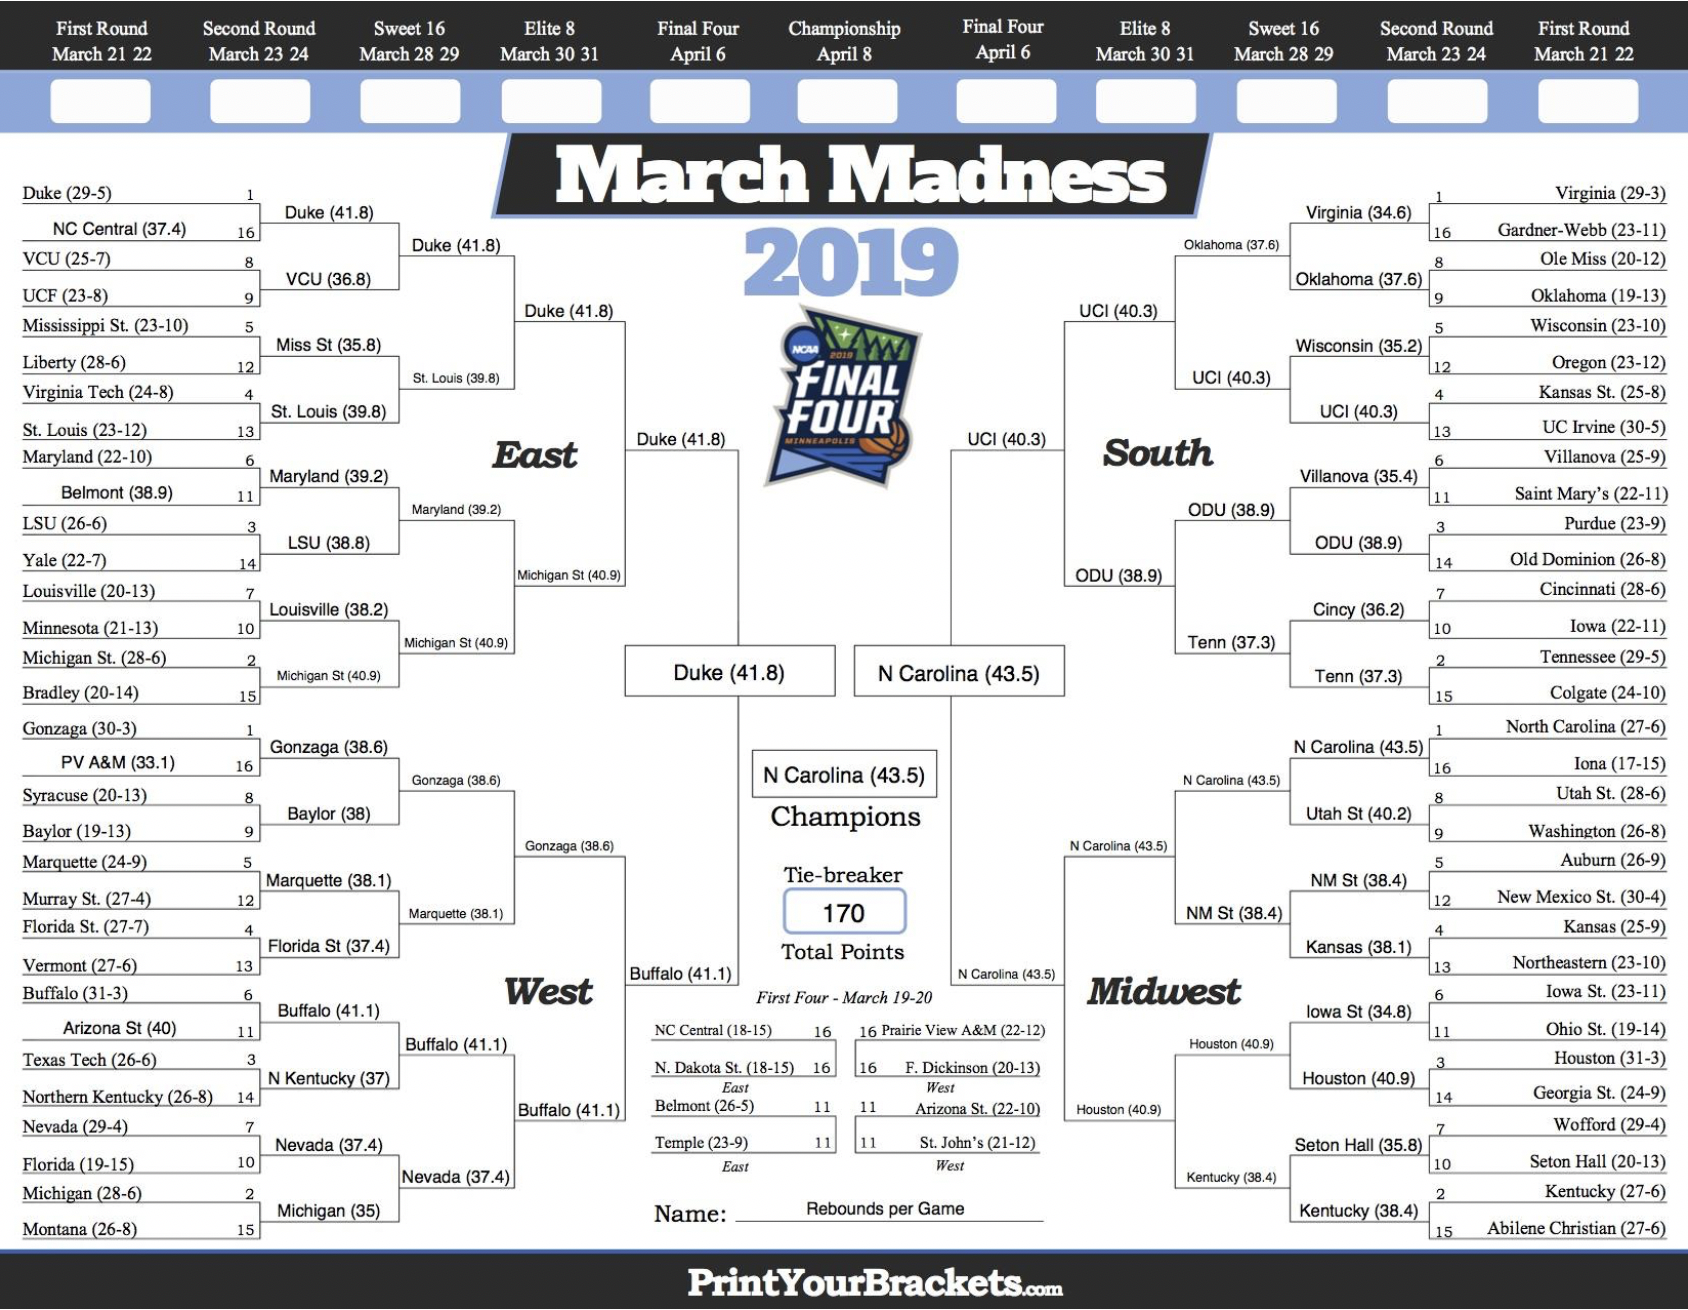
The Tar Heels of North Carolina lead the nation in rebounding. A frontcourt rotation of Luke Maye, Garrison Brooks, and Nassir Little get it done on the boards and coach Roy Williams has made rebounding UNC’s bread and butter for years. If you like tough box outs and securing the ball at a high rate, the Heels are your pick.
In the arduous process of crafting these single-stat brackets, I became a bit curious. I decided to create a simple ranking system across multiple statistics. I ranked teams 1-68 in all of the above statistics as well as turnovers per game (least is best), offensive rebounds per game, fouls per game (least is best), opponent fouls per game, and average score margin. Then, I took the averages of each team’s rankings across every stat. The lowest average would be the best ranking, meaning more of its individual rankings were higher. The bracket yielded from this process is as follows:
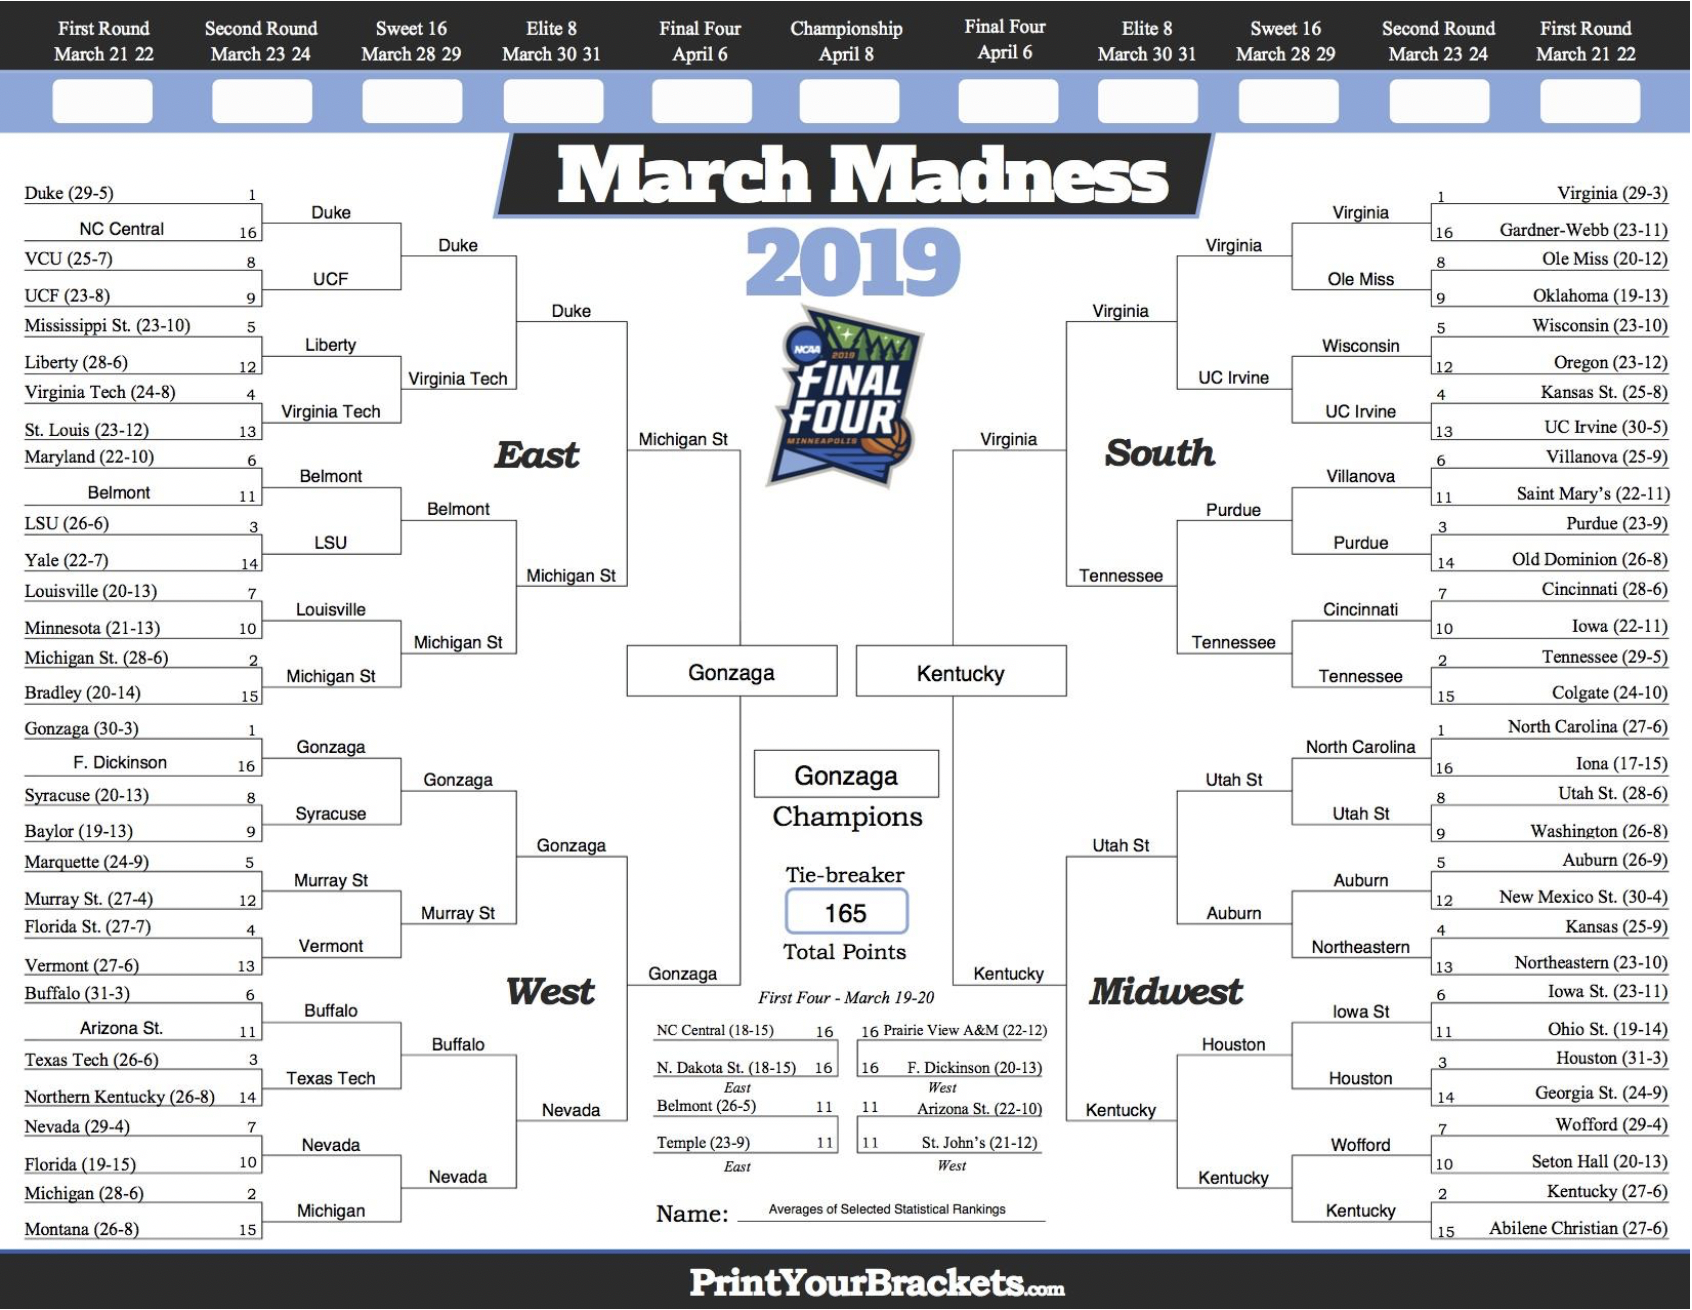
Gonzaga had the lowest composite score, making them the champions of this multi-stat bracket. If the stats do not lie (they rarely do), the Bulldogs could be primed for their first ever championship. They reached the game in 2017 but fell short to the UNC Tar Heels.
Another thing that piqued my interest were the game sites. I decided to make a bracket based on each team’s campus’ proximity to the arena where the game would be played. This is inspired, in part, by Dayton’s 2-win run from their hometown First Four game to the round of 32. This is not exactly one for the history books however it was clear that playing in Dayton and then in Columbus gave Dayton the feel of home games even though they will go down in the books as neutral site games. View the bracket here and note that the mile distances from the game sites are listed in parentheses.

A key team to look out for this year is the Cincinnati Bearcats as they will play their games in Columbus and then Louisville if they make it that far. Those sites are close to their hometown so you can expect Cincy fans to pack the house and give the Bearcats a home game feel. The champion in this bracket, however, is the Iowa State Cyclones. Iowa St. will never play within 200 miles of their campus however they have a favorable “home court advantage” in each of their potential matchups.
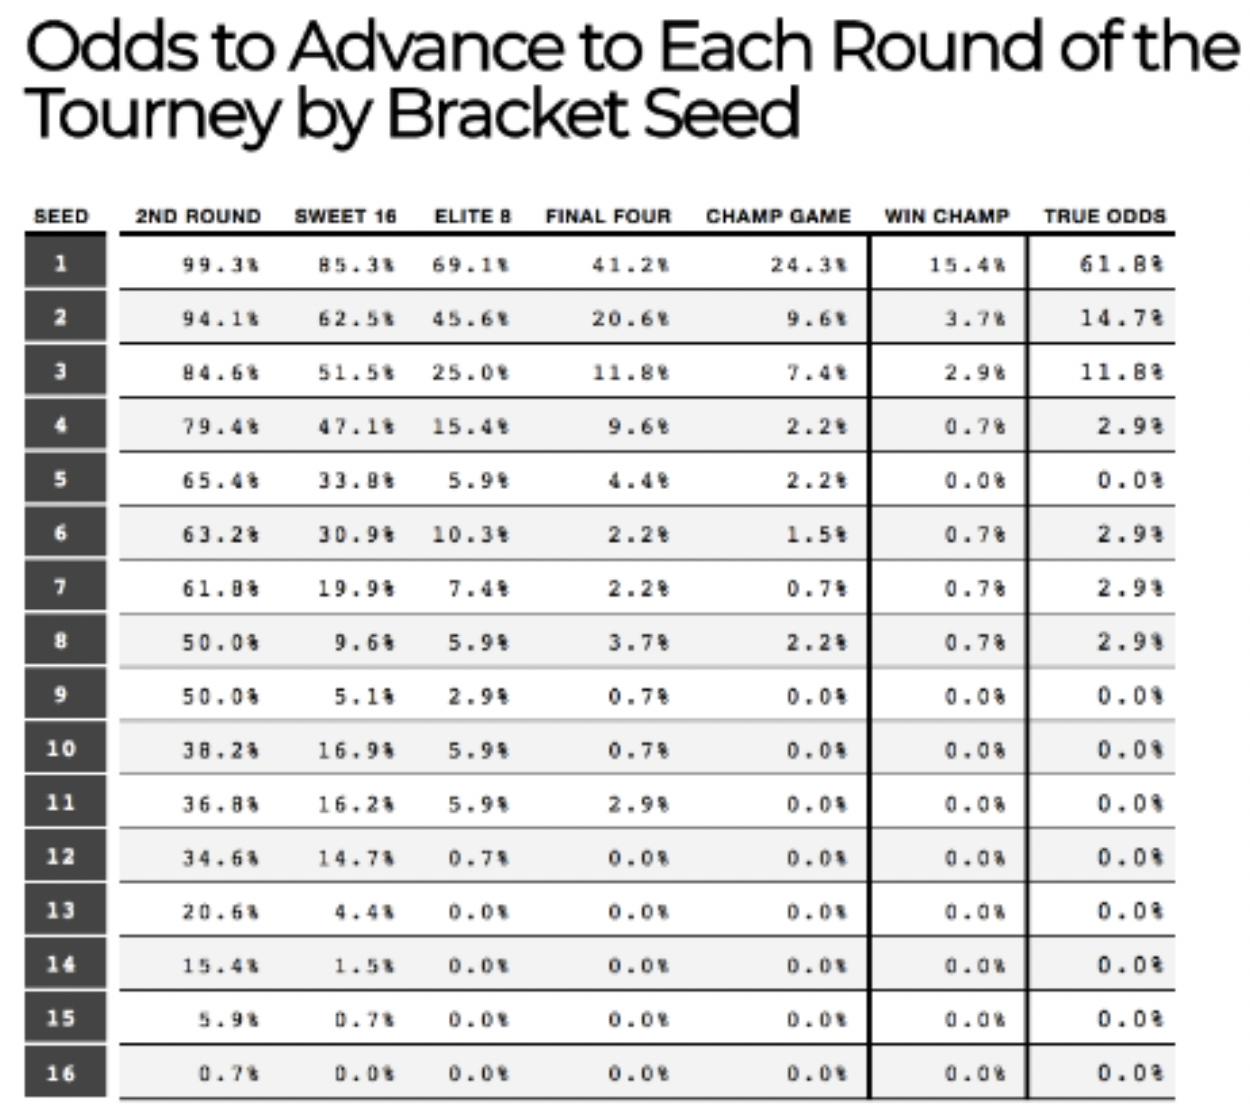
There is yet to be a sure formula when it comes to the NCAA tourney and it remains to be seen if anyone will ever even get close to the billion dollar pot for having a perfect bracket. Yet, that doesn’t stop us from trying to predict every upset and cinderella run. In fact, whether you are one of those people who changes answers on multiple choice tests because the same answer appears too many times in a row or you like making picks based off the odds, here is the breakdown on the odds each seed has to win in each round, courtesy of betfirm.com.
When it’s all said and done, we will see which of these brackets does the best and which get busted. Surely, it won’t provide a sure answer but this could serve as a step forward in identifying which aspects are more important than others when evaluating March Madness teams.
From all of us here at SAGB, good luck bracketing and Happy March!