Decoding The Draft: From Lottery to Lackluster
By Riley Henderson | September 9, 2019
Each June, millions of captivated fans shift their eyes to the NBA Draft to follow the myriad of ways that it could unfold. The beginning of the program almost always delivers in magnitude and intrigue as lottery picks generate plenty of buzz, mounting the stage with the promise of single handedly transforming broken franchises into perpetual contenders. The next segment of the broadcast carries on the excitement as the rest of the league makes its first selection. However, after 30 names have been called, many of us change the channel back to American Idol, Jeopardy, or whatever else we had on before. What is the reason for this growing phenomenon? It would make perfect sense if we were talking about baseball, whose draft can go up to 40 rounds. But why the NBA? Well, for one, many general managers have started to treat the 2nd round as nothing more than debris, perplexing viewers with their capitulation of picks for mere “cash considerations.” Thus, the apathetic attitude of fans toward Round 2 has ultimately reflected the prevailing attitude of the the teams themselves. Nevertheless, the cash considerations frenzy has only played a modest role in a much larger trend toward the leveraging of current and future 2nd round picks for any assets teams that can get, whether it be the money, players, or 1st round picks. In the 2018-2019 NBA Season, 2nd round picks were dished out a grand total of 44 times, far surpassing the 10 1st round picks traded over the same span. Since this strategy has never garnered as much support as it has in recent years, I resolved to investigate its merit in today’s game by quantifying the average value of each pick in the NBA Draft, from the 1st overall pick to the 60th. After all, fans know that players as prominent as Draymond Green, Marc Gasol, and DeAndre Jordan have seen their names come off the board in the second half of the production. Are teams making the right decision or passing up on perennial contributors? Using a statistic known as Win Shares, which represent the number of wins that each player has accounted for since he was drafted, I looked at the net achievement of each draft position over the course of the last 30 drafts. The bar chart below summarizes the general decline in mean and median Win Share values as the draft progresses.
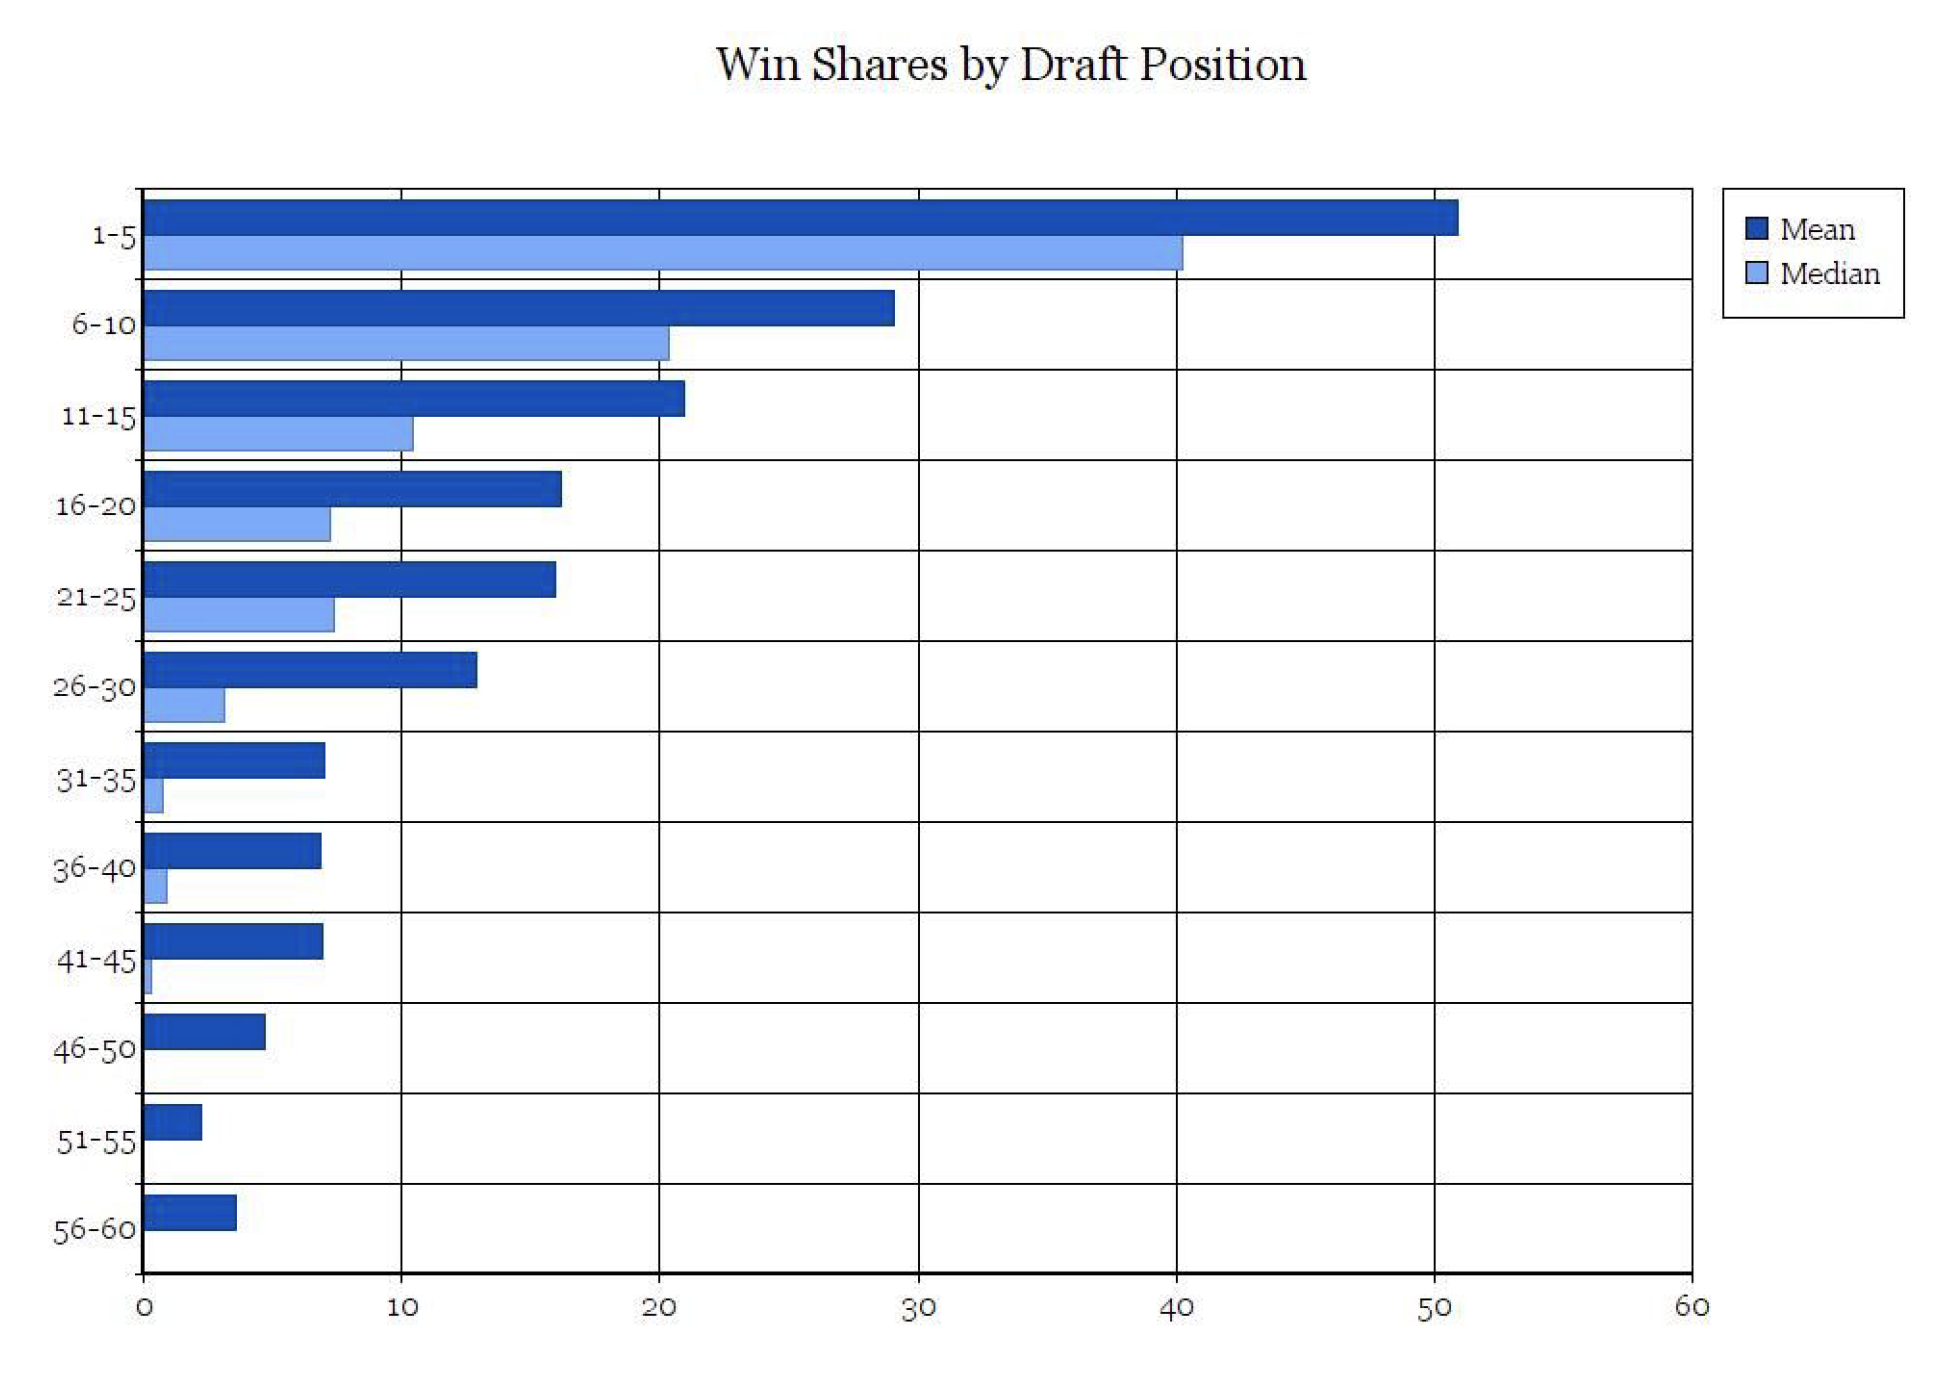
The figure likely encapsulates what is to be expected— that is, a stepwise decrease in relative value provided, with limited exceptions. Perhaps more expressive of a gaping disparity, the bar graph below compares the mean and median Win Shares between the first and second rounds.
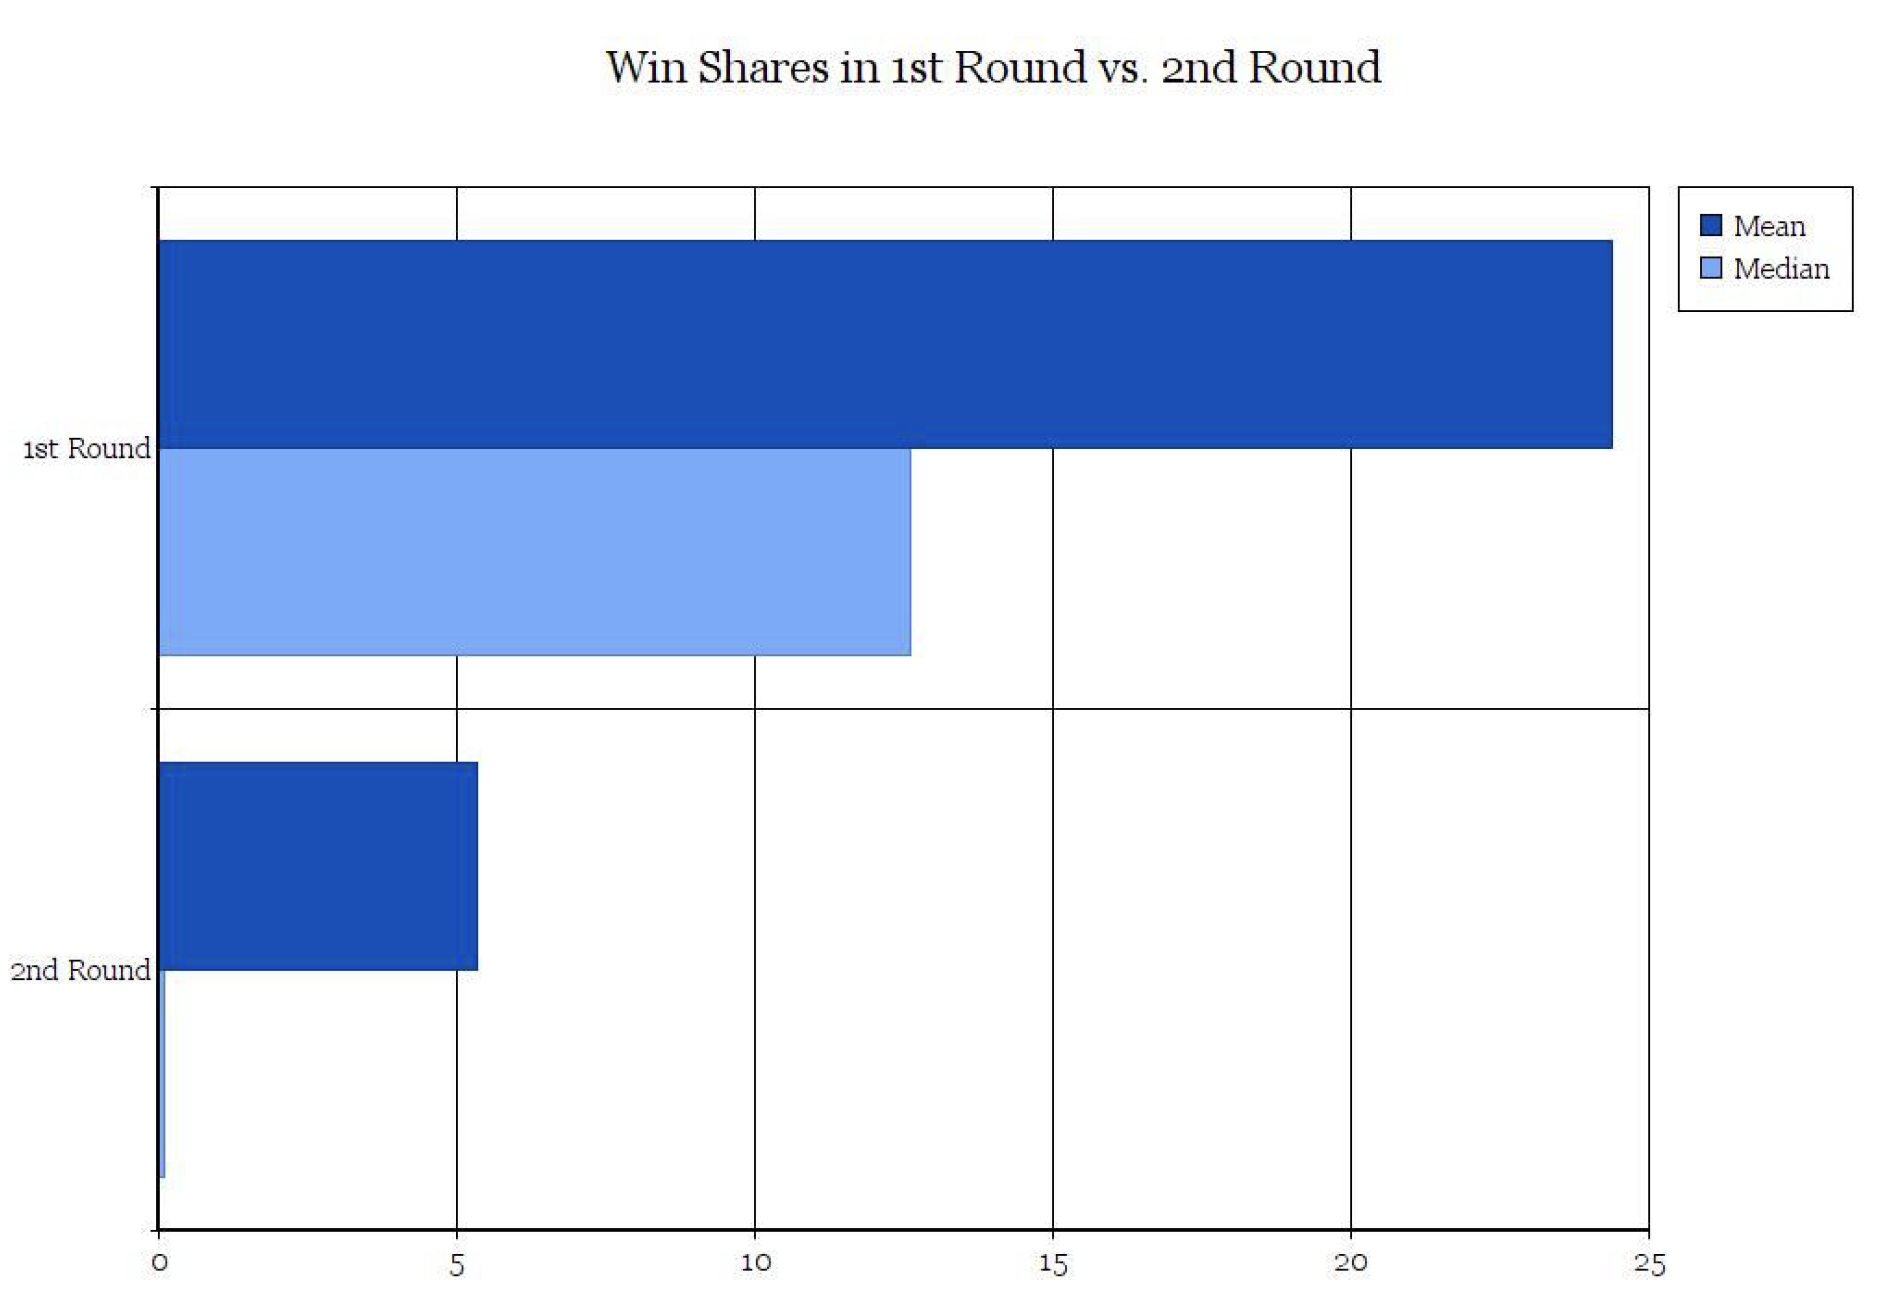
Notably, over the last 30 years, 2nd round draft picks have rewarded their respective teams with a median amount of Win Shares of approximately zero . That essentially means that a given player selected in Round 2 has as good a likelihood of not reaching the floor as he does of getting any minutes at all. This negligible contribution helps to explain the broadening perception in front offices of the second round as second rate. Moreover, the pie chart below augments this reality, representing the overwhelming percentage of total Win Shares in the draft found in the first round versus the second round.
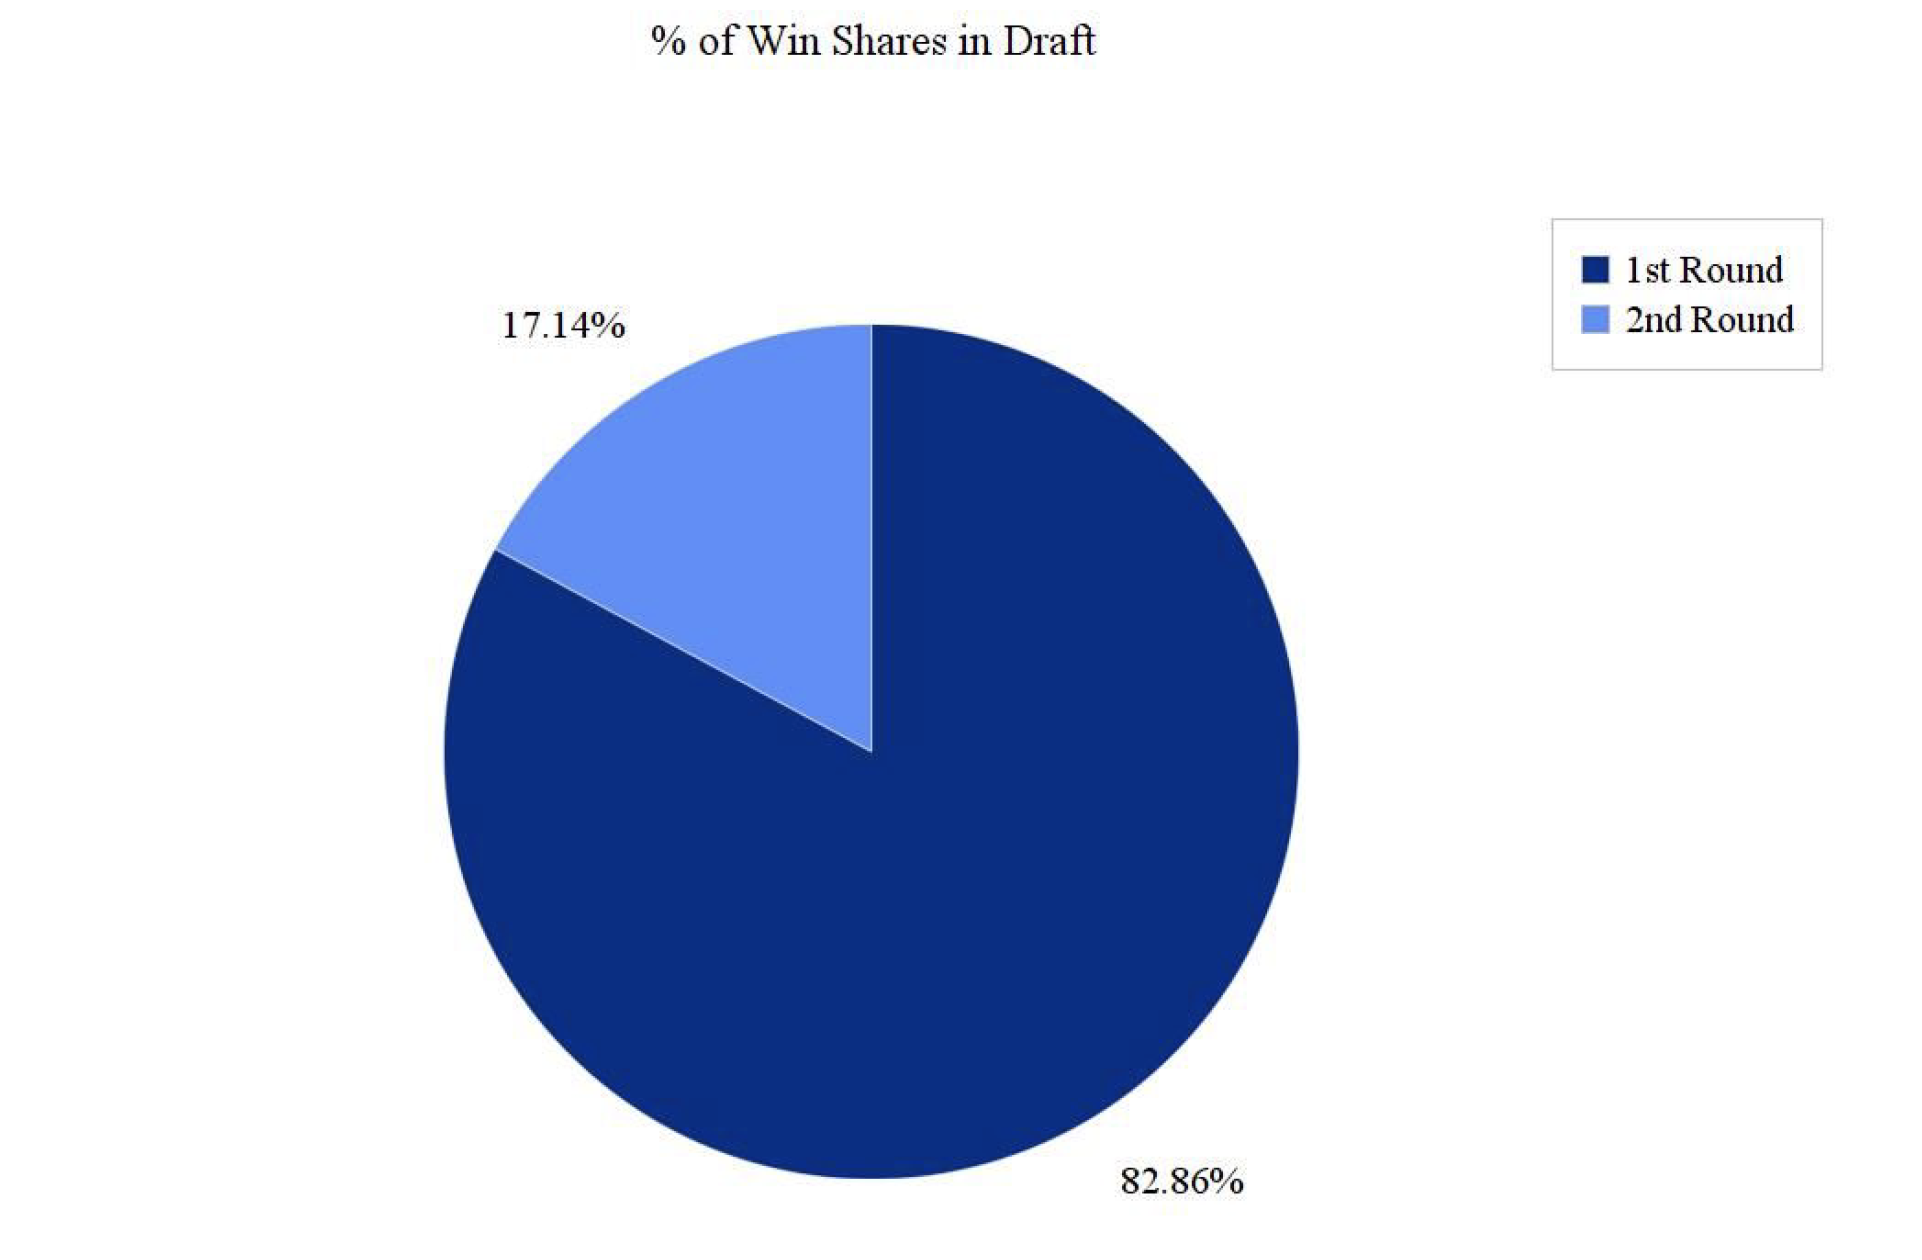
If over 80% of the value in the draft is off the board by Pick 30, it becomes more and more understandable why fans call it a night before Round 2 even begins. Nevertheless, these visualizations do not tell the full story of the NBA Draft, and further stratification of Win Share value proves to yield valuable insight:
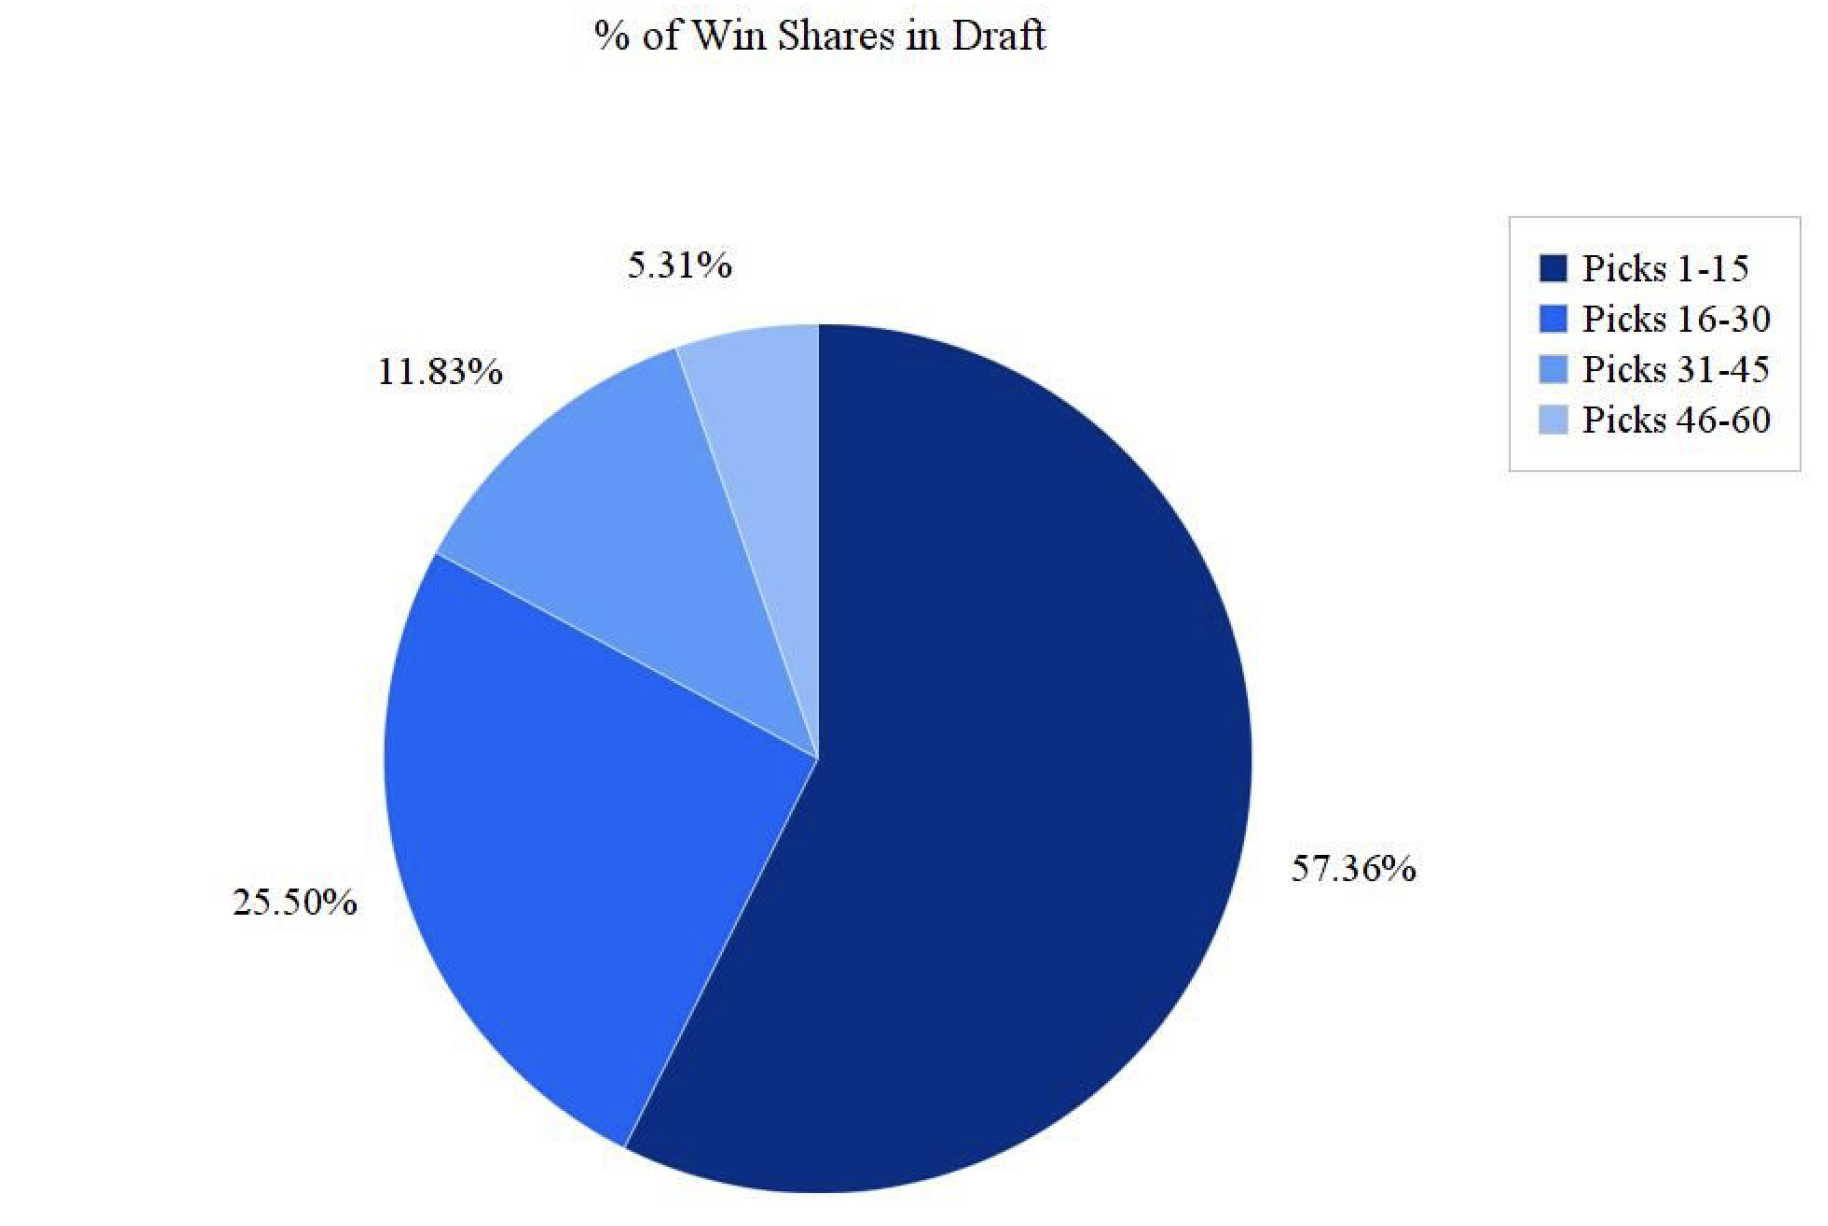
Dividing the draft into 4 quadrants, one can observe the exceedingly high relative value of mean Win Shares supplied by the first fifteen picks in comparison to the rest of the draft. Corresponding roughly with the first hour of the draft, the lottery picks, comprised of the first 14 selections made by teams that failed to reach the playoffs, are shown to offer extreme value. In fact, over the course of the last 30 years, the lottery itself has accounted for more than half of the Win Shares of the entire draft. Hence, the unmatched utility of a lottery pick serves to justify emerging another trend seen across the NBA: the proliferation of tanking.
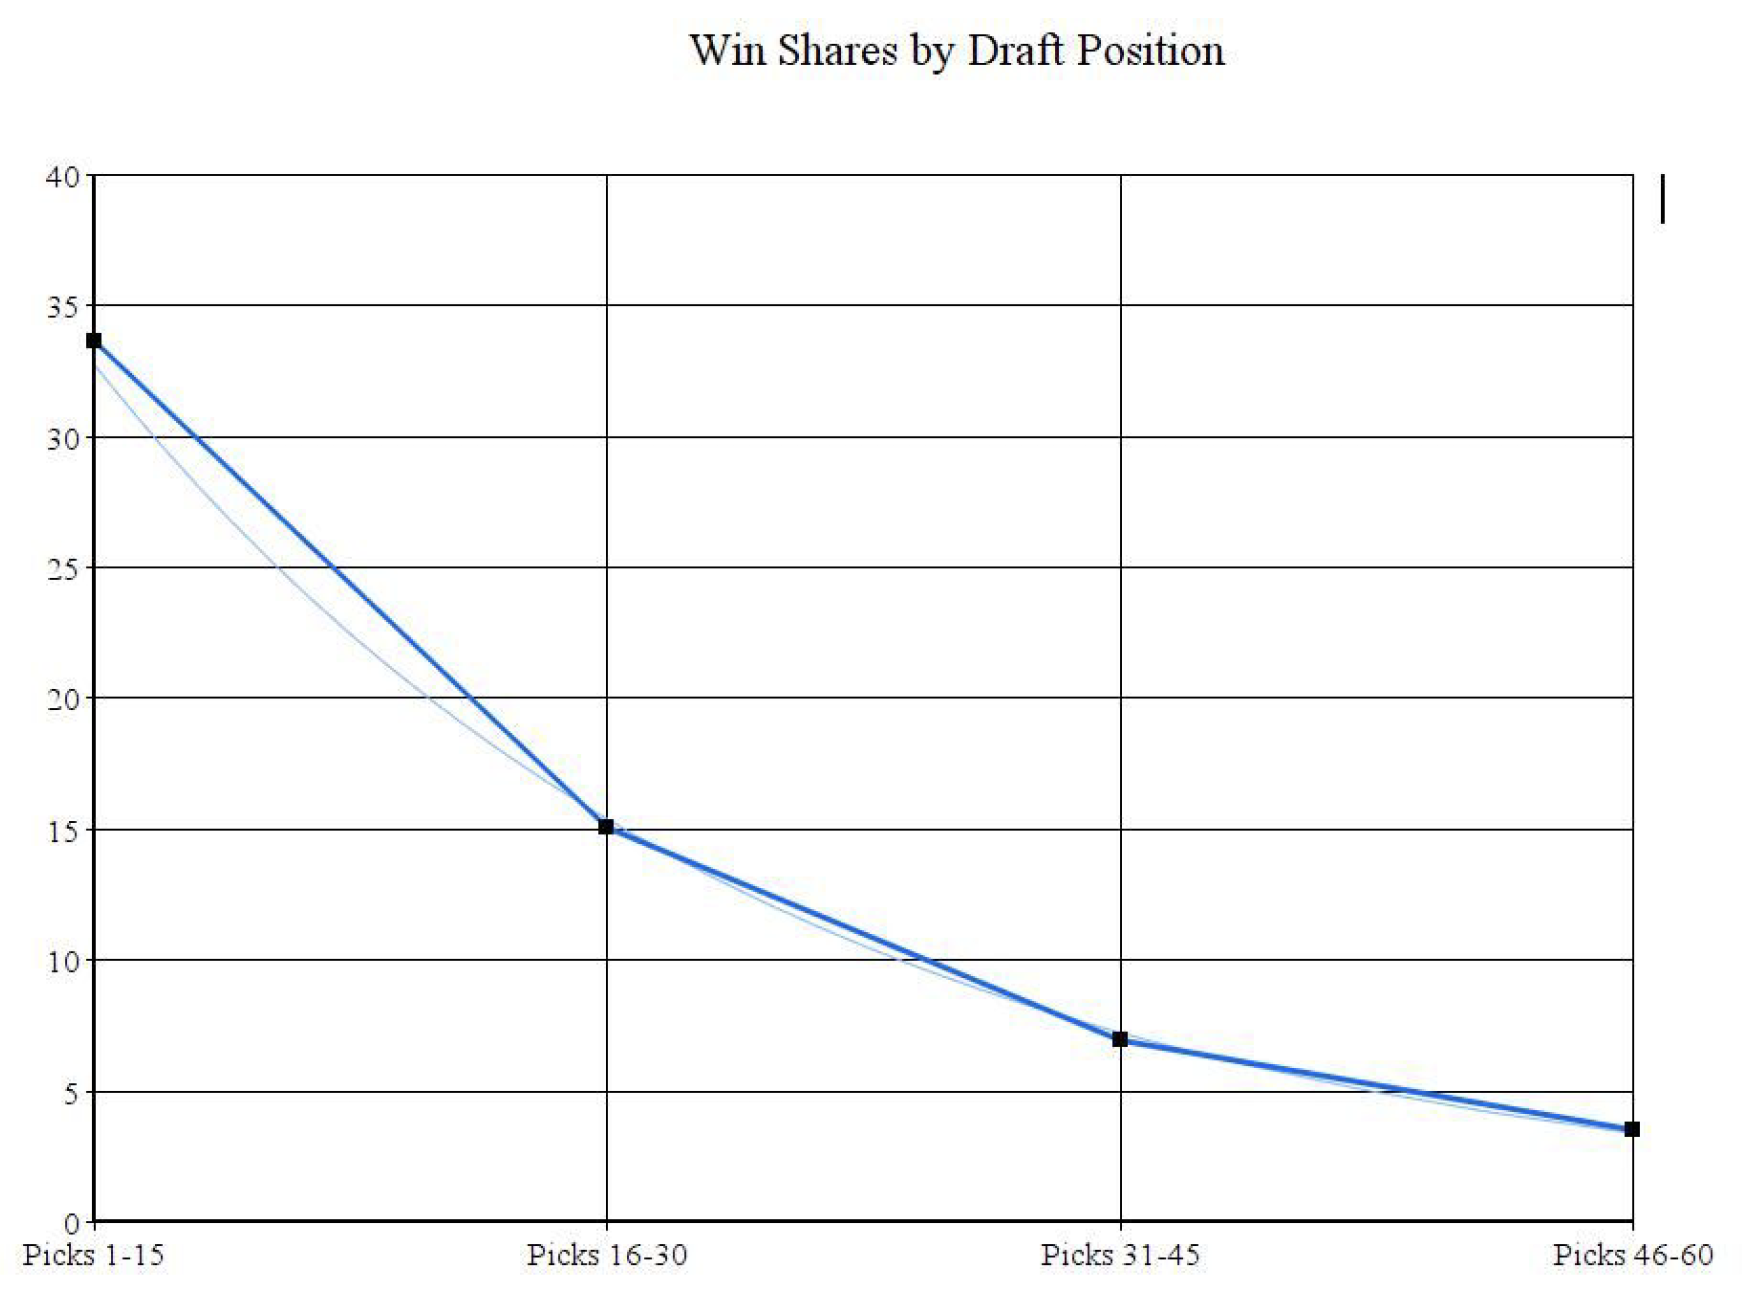
Lastly, to provide a better sense of the degree to which the draft follows a course of exponential decay (as well as an exponential loss of viewers), the line graph above set next to an exponential trend line displays the exponentially depreciating value of mean Win Shares available as each minute of the program passes.