NFL MVP: What It Means Vs What It Should Mean
By Nathan Mehta | May 18, 2022
It’s easy to get caught up in the semantics of the NFL’s prestigious “Most Valuable Player” award. The wording of the award can adopt a plethora of meanings depending on the interpretation. Does ‘Most Valuable’ essentially equate to ‘Best Player’ in your mind? Should the MVP award be awarded to the best player, regardless of the meaning of the phrase? These are conversations that circulate amongst barbershops when debating the MVP.
Whether or not you believe the MVP should award the most “valuable” or “best” player, the award is currently decided in a way that doesn’t use either criterion. The award as it is really should be called “MVPOTTWTBR” - Most Valuable Player on the Team With the Best Record. Very cluttered acronym, I know, but it certainly would be more apt.
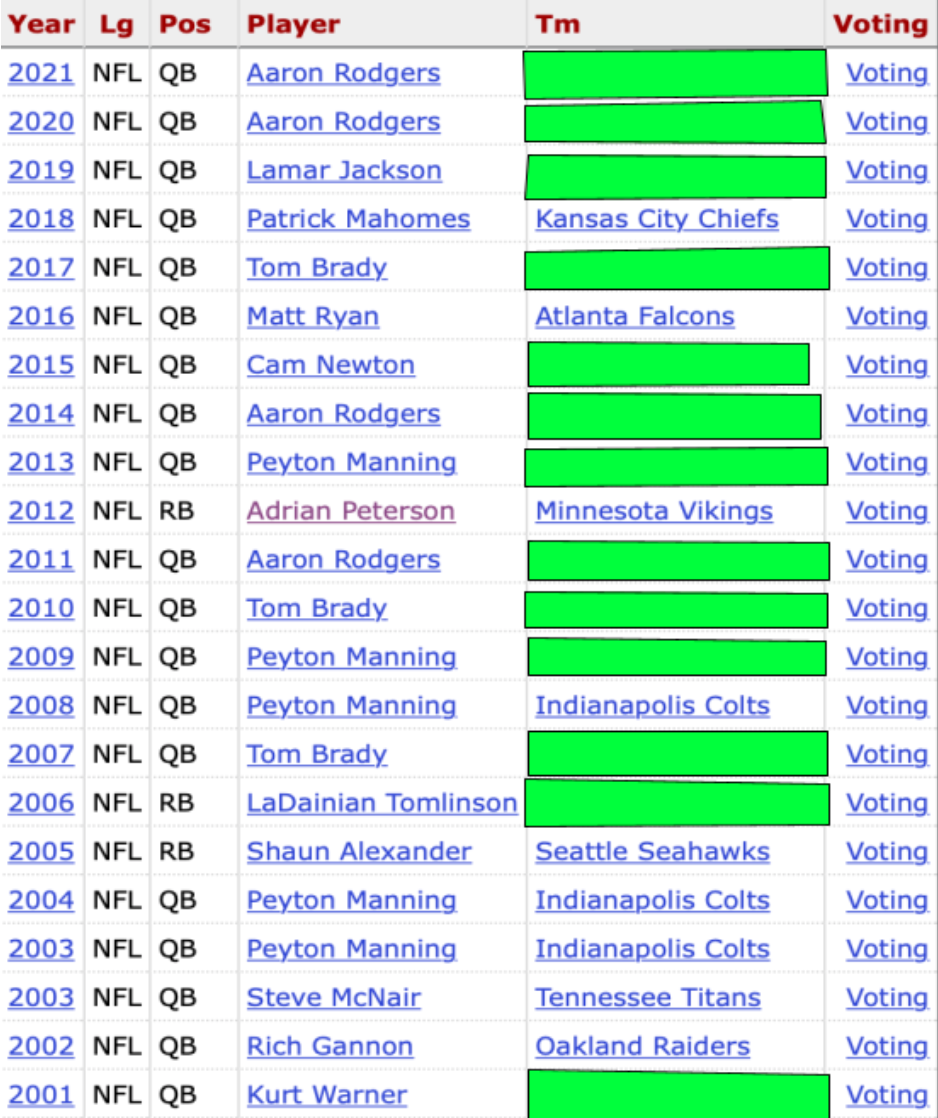
Here, we have the last 20 MVPs listed. The green highlight indicates that the player was on the team with the best record. Noticeably, the table is marked up heavily with green. In the last 16 years, a player on the team with the best record won the award 12 times. It’s safe to say that being the signal-caller on the winningest team gives you a decent chance at securing the award. That’s not to say that any one of these players are undeserving, but perhaps the award isn’t evaluated in terms of “The Most Valuable” in reality. If that were the case, there’s no reason why a player on other teams shouldn’t win more often.
The award can be made legitimate by considering more indicative stats besides team record in the evaluation process to reveal the optimal combination of value and skill in a player.
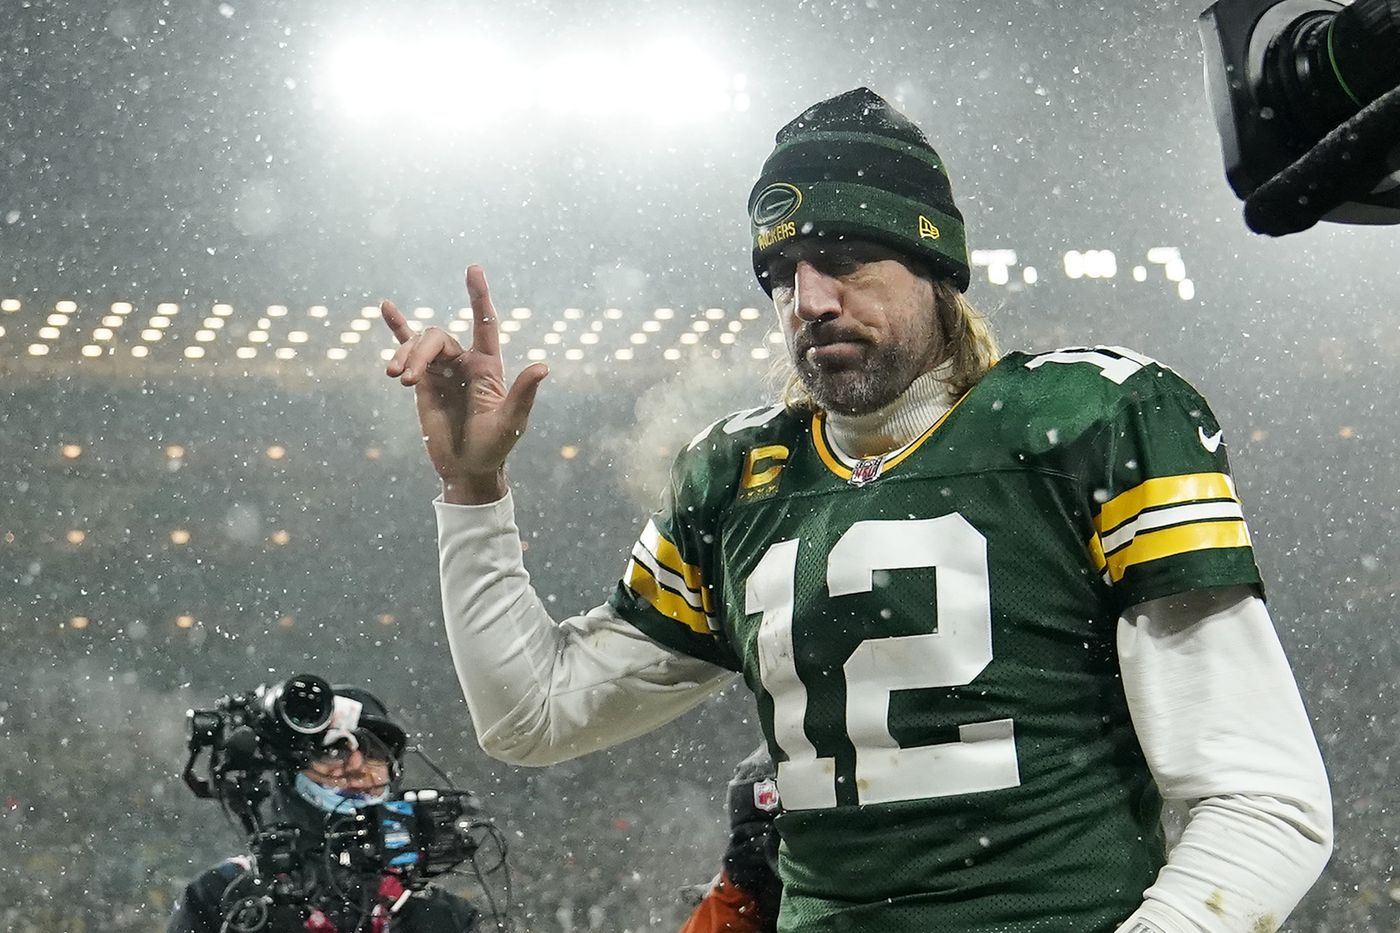
The MVP of this last year, Aaron Rodgers, had another stellar statistical season. He threw for 4115 yards, 37 touchdowns, and 4 interceptions while leading the NFL in passer rating (aggregate measure of QB play taking into account completion percentage, yards per attempt, touchdown percentage, and interception percentage). You guessed it, Rodgers’ Green Bay Packers also happened to have the best record in the NFL. What a coincidence! All these factors appear to result in the “ideal” candidate. As much as the NFL MVP voters would probably like to vote against the condescending and “immunized” Aaron Rodgers, he seems to have cracked the code to the MVP award: throw lots of touchdowns, with efficiency, while being on the best team. However, I will make the argument that although he was a qualified candidate, he wasn’t the right choice. I won’t be using his vaccination status against him in this case, but I will attempt to facilitate a rethinking of the way that the MVP is judged.
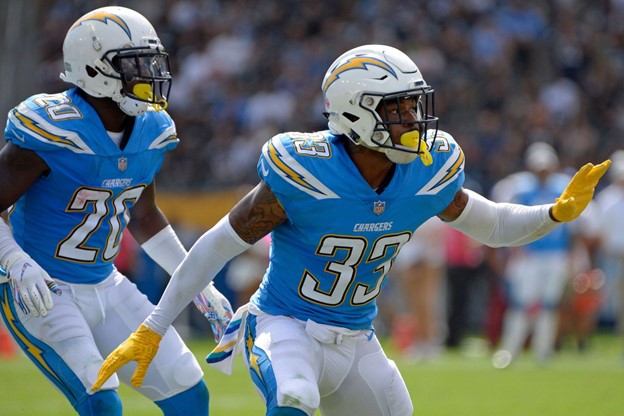
In order to create new criteria for evaluating MVP, it’s worthwhile to discuss the significance of certain quarterback metrics. The most basic statistics consist of yards thrown, touchdowns thrown, completions and interceptions. These stats are accessible and transparent: it’s easy to see the utility in them. Intuitively, more yards and more touchdowns, with less balls thrown to the other jersey color would equate to a good quarterback. While this equation isn’t necessarily wrong, it leaves out some elements. While it’s true that for the most part, the better quarterbacks throw for many yards and touchdowns, these stats are not indicative of MVP play in the modern NFL. Since all teams throw the ball more each year, throwing for many yards and touchdowns is not as strongly correlated with exceptional quarterback play as it once was. The average number of passes thrown per game in 1979 was 29.0, and that number has steadily increased over the past 40 years, reaching 35.2 passes per game in 2020. Only one quarterback threw for 4000 yards in the 1979 season, Hall of Fame Quarterback Dan Fouts of the San Diego Chargers. Meanwhile, the 4000 yard achievement has ceased to even be considered an achievement in the year 2021:
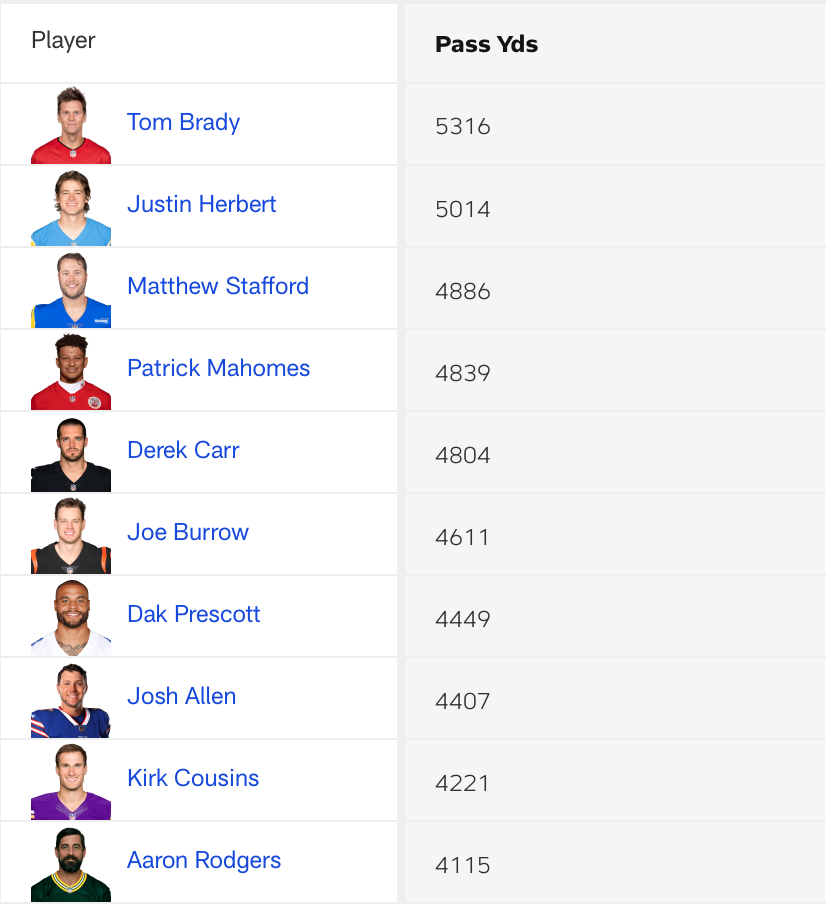
This table from NFL.com shows all the 4000 yard passers for the 2021 NFL season. Amongst the group, a few names stand out that are considered football royalty: Tom Brady, Aaron Rodgers, Patrick Mahomes. These players are arguably the greatest to ever sling a football. To reiterate, yes, the set of 4000 yard passers will surely contain the consensus best quarterbacks as a subset. However, although almost all great quarterbacks are 4000 yard passers, the converse proposition is not necessarily true. All 4000 yard passers are not great quarterbacks. For example, in the table above, a few mediocre quarterbacks round out the list. Dak Prescott and Kirk Cousins turned in adequate seasons, but surely nobody that has watched a down of football would campaign for them as the best NFL player. Although, I wouldn’t put it past Cowboys fans. 1979’s 4000 yard passer, Dan Fouts, finished second in MVP voting, while 8 out of 10 of the 4000 yard passers in 2021 received 0 votes. This is why it’s necessary to supplement volume stats (passing yards, touchdowns, completions and interceptions) with efficiency stats when evaluating quarterbacks. It serves us to know who produces the most per every pass, per every game, etc. These stats show how effective a player is in making the most of their opportunities. The aforementioned quarterback rating, created in the 1950s, accounts for efficiency by including completion percentage, yards per attempt, touchdown percentage, and interception percentage in its calculation. These measures accurately encapsulate efficiency of quarterback play.
Given that Aaron Rodgers has lead the NFL in passer rating in the last two seasons (Rodgers holds the single season record for passer rating at 122.5 in 2011), he would seem to have the MVP on lock. He has it all: volume, efficiency, and regular season team success. However, I maintain that Rodgers was not the most valuable player in the NFL for the 2021 season due to one other factor I’d like to introduce in tandem with volume and efficiency: equipoise. Equipoise, meaning the balance of opposing forces. I’ll explain what I mean exactly: When examining the stats of a quarterback, there are certain statistics that are contradictory, working against each other. For example, I would call yards per attempt and completion percentage contradictory in the sense that a quarterback that throws longer passes is more susceptible to incompletions due to the higher degree of difficulty of throw. Therefore, a quarterback that displays yards per attempt and completion percentage numbers above the mean would have good equipoise.
With the advent of NFL Next Gen Stats in 2015, new measures can give us novel insight into a quarterback’s equipoise. Next Gen Stats utilizes chips placed in the players’ shoulder pads to accumulate tracking data on the movements of players. The new repertoire of metrics includes : (Explanations from nextgenstats.nfl.com)
- Time to throw (TTT): Time to Throw measures the average amount of time elapsed from the time of snap to throw on every pass attempt for a passer (sacks excluded).
- Completed Air Yards: Air Yards is the vertical yards on a pass attempt at the moment the ball is caught in relation to the line of scrimmage. CAY shows the average Air Yards a passer throws on completions. Air Yards is calculated into the back of the end zone to better evaluate the true depth of the pass.
- Aggressiveness %: Aggressiveness tracks the amount of passing attempts a quarterback makes that are into tight coverage, where there is a defender within 1 yard or less of the receiver at the time of completion or incompletion. AGG is shown as a % of attempts into tight windows over all passing attempts.
- Completion Probability: The probability of a pass completion, based on numerous factors such as receiver separation from the nearest defender, where the receiver is on the field, the separation the passer had at time of throw from the nearest pass rusher, and more.
- Expected Completion Percentage: Using a passer’s Completion Probability on every play, determine what a passer’s completion percentage is expected to be
- Completion Percentage Above Expectation: A passer’s actual completion percentage compared to their Expected Completion Percentage.
Let’s dissect some of the new data offered by Next Gen Stats to see where we can determine the factors that will contribute to a quarterback’s equipoise. Here are ingredients to consider:
- Aggressiveness% vs. Completion Percentage : A QB who throws into tight windows is bound to have a lower completion percentage.
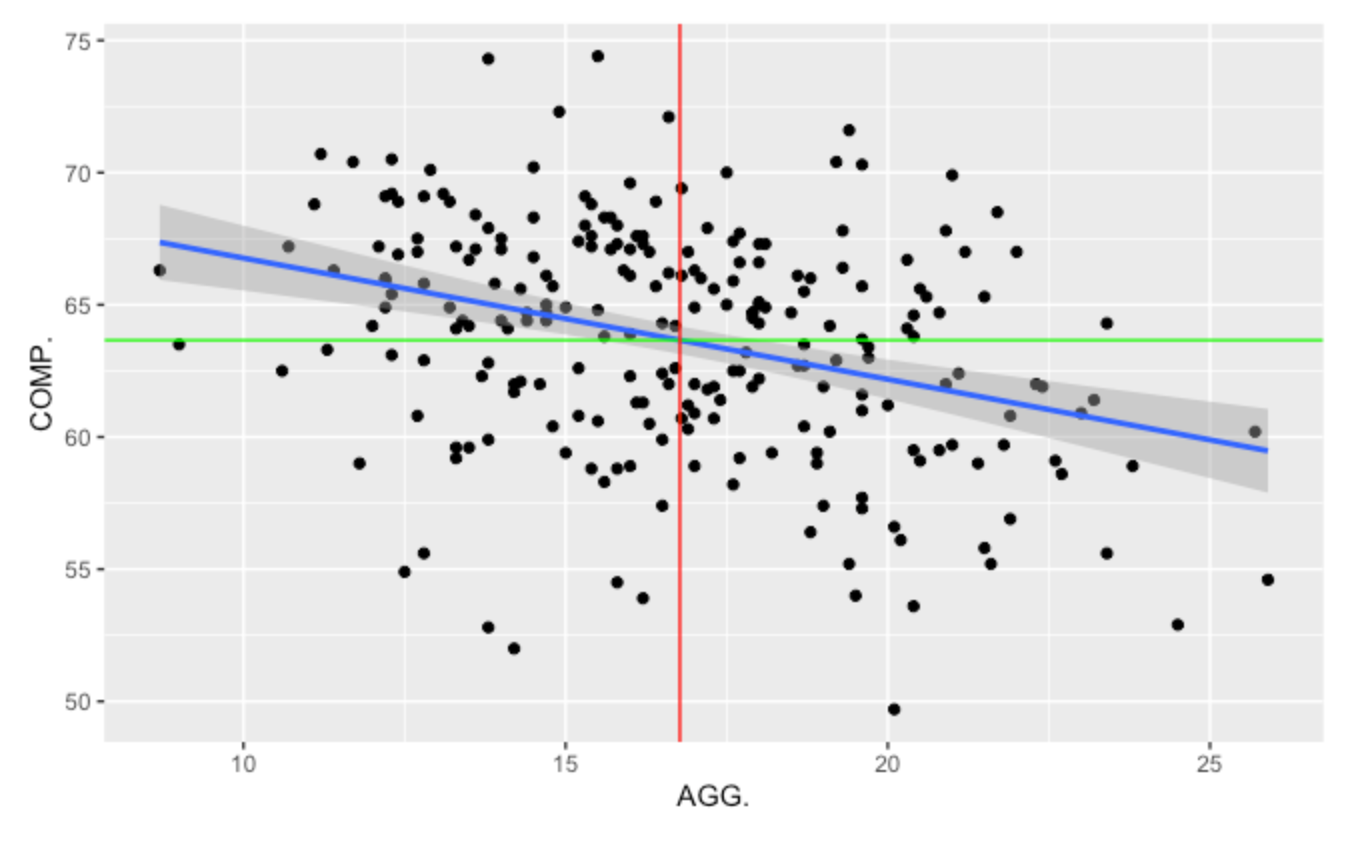
This graph shows aggressiveness percentage juxtaposed with completion percentage for every quarterback since 2015. The blue line indicates a trend line estimating expected values of completion percentage based on its relationship with aggressiveness. The negative correlation between these two variables influences the downward trajectory of the trend line as aggressiveness increases. The negative correlation gives me assurance that these two variables “oppose” each other for our purposes.
- Completed Air Yards vs Completion Percentage : A QB who throws farther passes is susceptible to more incompletions. Negative correlation between these two variables as well, indicating their opposition to each other.
Equipose Calculation: - QB that maximizes AGG, COMP%, CAY, YDS.
In addition to considering stats that oppose each other, equipoise maintains standards of volume (YDS), and efficiency (COMP%)
I figured I would accumulate all these selected stats for all quarterbacks since 2015 (the birth of Next Gen Stats). I filtered the dataset to find which QBs over the years have posted the best equipoise numbers:
I began by isolating the players that were 75th percentile (in the top 25 percent of players) in each of AGG%, COMP%, CAY, and YDS.
That left just one player since 2015:

Former Falcons quarterback Matt Ryan established himself as the gold standard for equipoise in 2016, when he was awarded the MVP. This pleased me to find that the best statistical equipoise season ever recorded aligned with MVP voting. Interestingly enough, as you can see from the list of MVP winners in the beginning of this article, the Falcons did not post the best record in the NFL that season. I’m lead to believe that Ryan was simply too good for the voters to ignore in 2016, even without playing on the best regular season team. Matt Ryan won the MVP without carrying the “MVPOTBT” (Most Valuable Player on the Best Team) tag which voters swoon over, and while also lacking the prestige of icons like Aaron Rodgers or Tom Brady. Matt Ryan has been a solid quarterback in the NFL for 15 years, but I doubt that his fan base has spanned much further than the city of Atlanta. So, good for you MVP voters, you got one right in 2016 at least.
That being said, what about all the other years where the champion of equipoise isn’t considered for MVP? We’ve learned that when the race for MVP is close, the voters default to their exhausted method of looking to team performance for answers. Surely, a player shouldn’t have to post Matt Ryan’s 2016 numbers to be in the conversation for MVP. It seems that these statistical elements that Ryan displayed in 2016 aren’t included in MVP deliberation unless the player happens to be positioned at a whopping 75th percentile.
With that being said, let’s go roll back our search a bit to examine all players above 65th percentile in these measures:
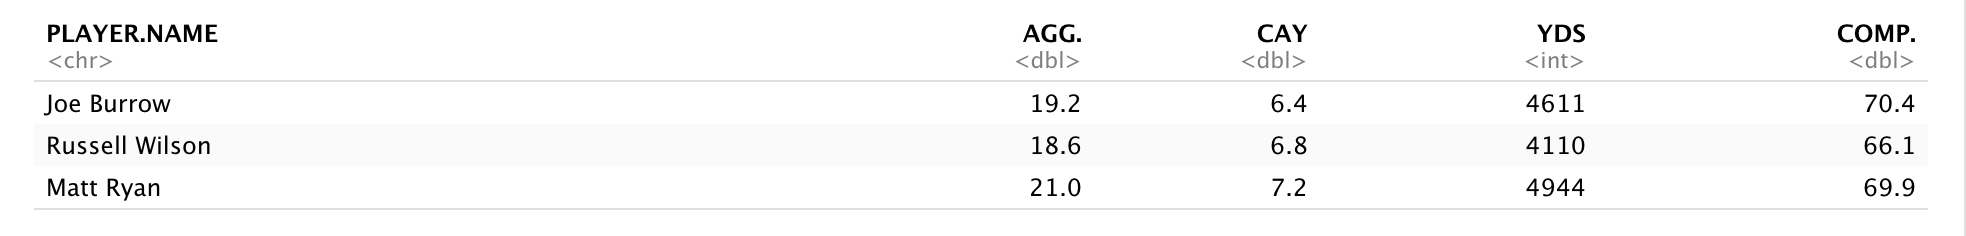
We have our silver and bronze medalists in equipoise : 2021 Joe Burrow and 2019 Russell Wilson.
Wait… 2021… Burrow? That is indeed, not Aaron Rodgers. In this past season we witnessed one of the most balanced statistical performances by a quarterback without realizing it. Meanwhile, the MVP award once again was handed to passer rating poster child Aaron Rodgers while Joe Burrow received 0 votes for MVP.
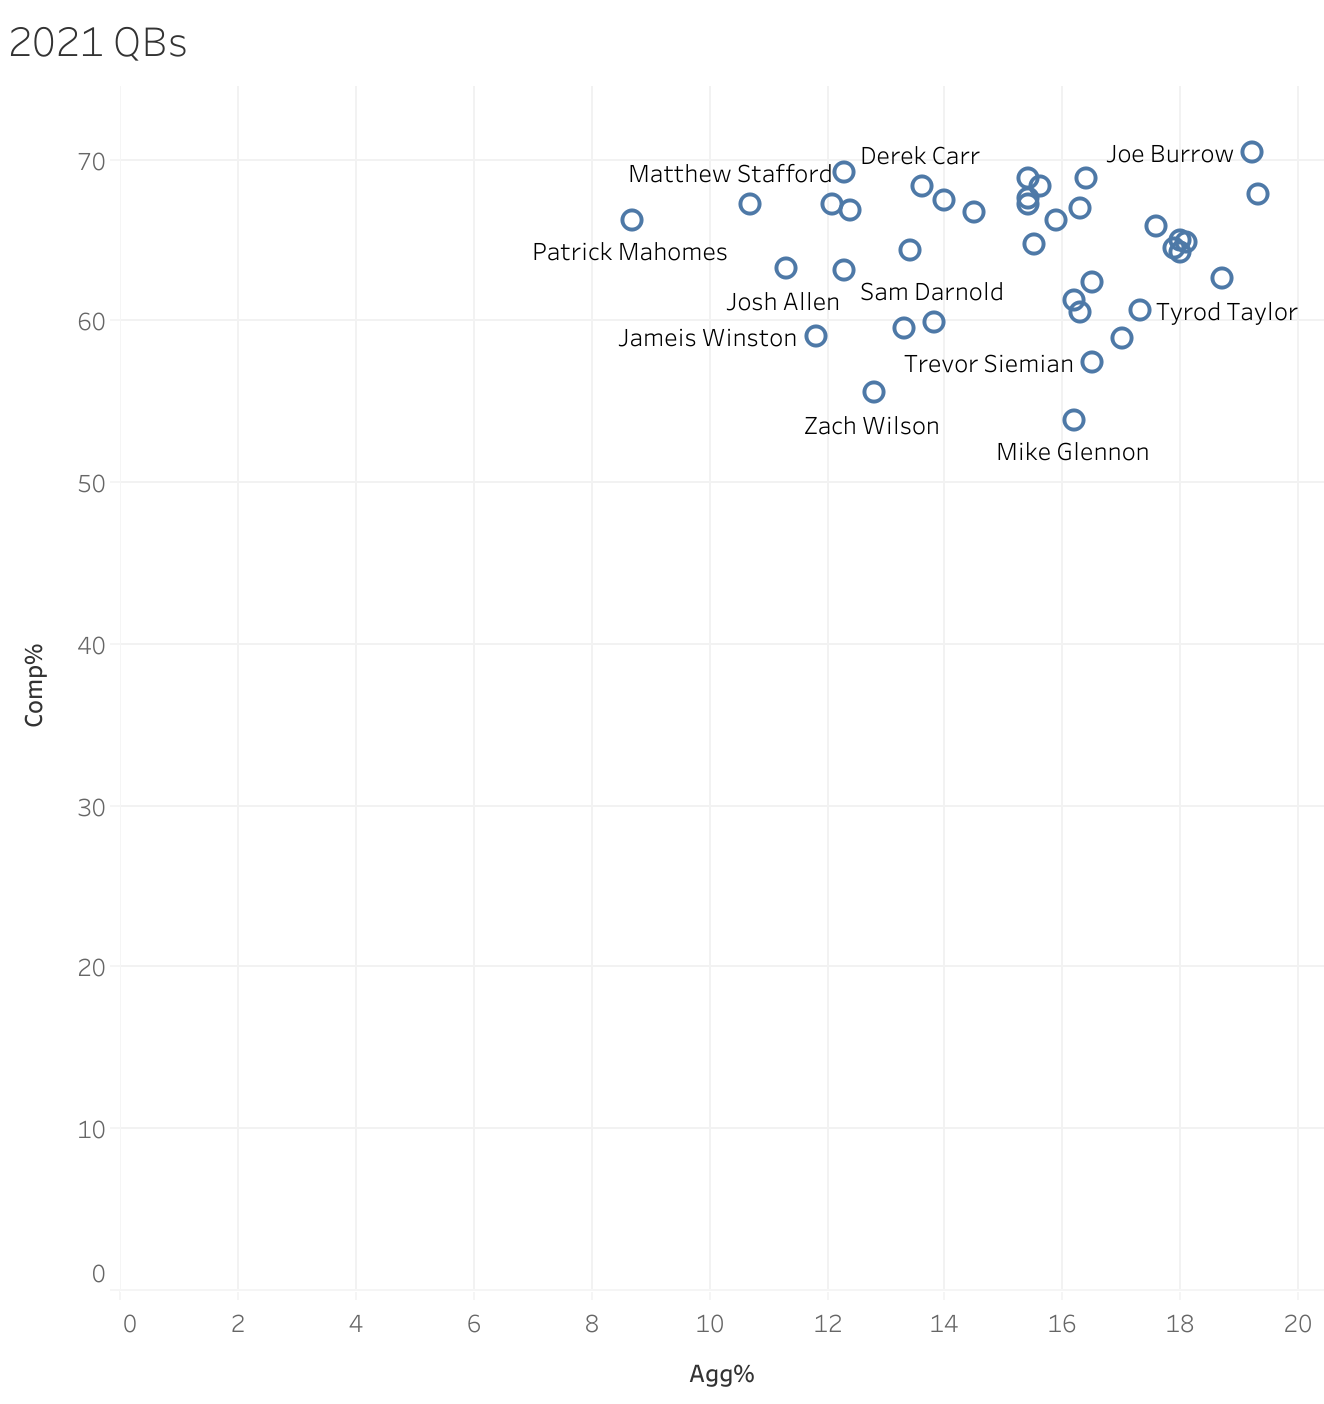
Moreover as this graph demonstrates, Burrow lead the entire league in Completion Percentage this season while also being SECOND in Aggressiveness. He completed the highest percentage of his passes while throwing into the tightest windows, deep down field:
That being said, although I believe Burrow should have won the award for his transcendent statistical season, Rodgers still had a superb season, as we have established. Rodgers represents regular season team success coupled with preeminent efficiency levels (corroborated by his passer rating and Completion Percentage). Many fans maintain that Rodgers’ stratospheric touchdown to interception ratio – 37/4 – keeps him at the top of the MVP race. However, Rodgers’ equipoise level is severely dragged down by his place at a meager 11th percentile completed air yards. Meaning, although Rodgers is accurate and throws for many yards, he does so without pushing the ball down the field. Much of his yards come from short gains, with a lack of risk taking. This conservative play style contributes to Rodgers’ lack of interceptions, and perpetual reign over the passer rating title !
To put the final nail in the Burrow MVP case, we will consider another revolutionary Next Gen Stats metric: Completion Percentage Above Expectation (CPAE) . The allure of this metric is that it takes into account completion probability, comparing throws of similar play conditions. Burrow lead the league in CPAE this season.
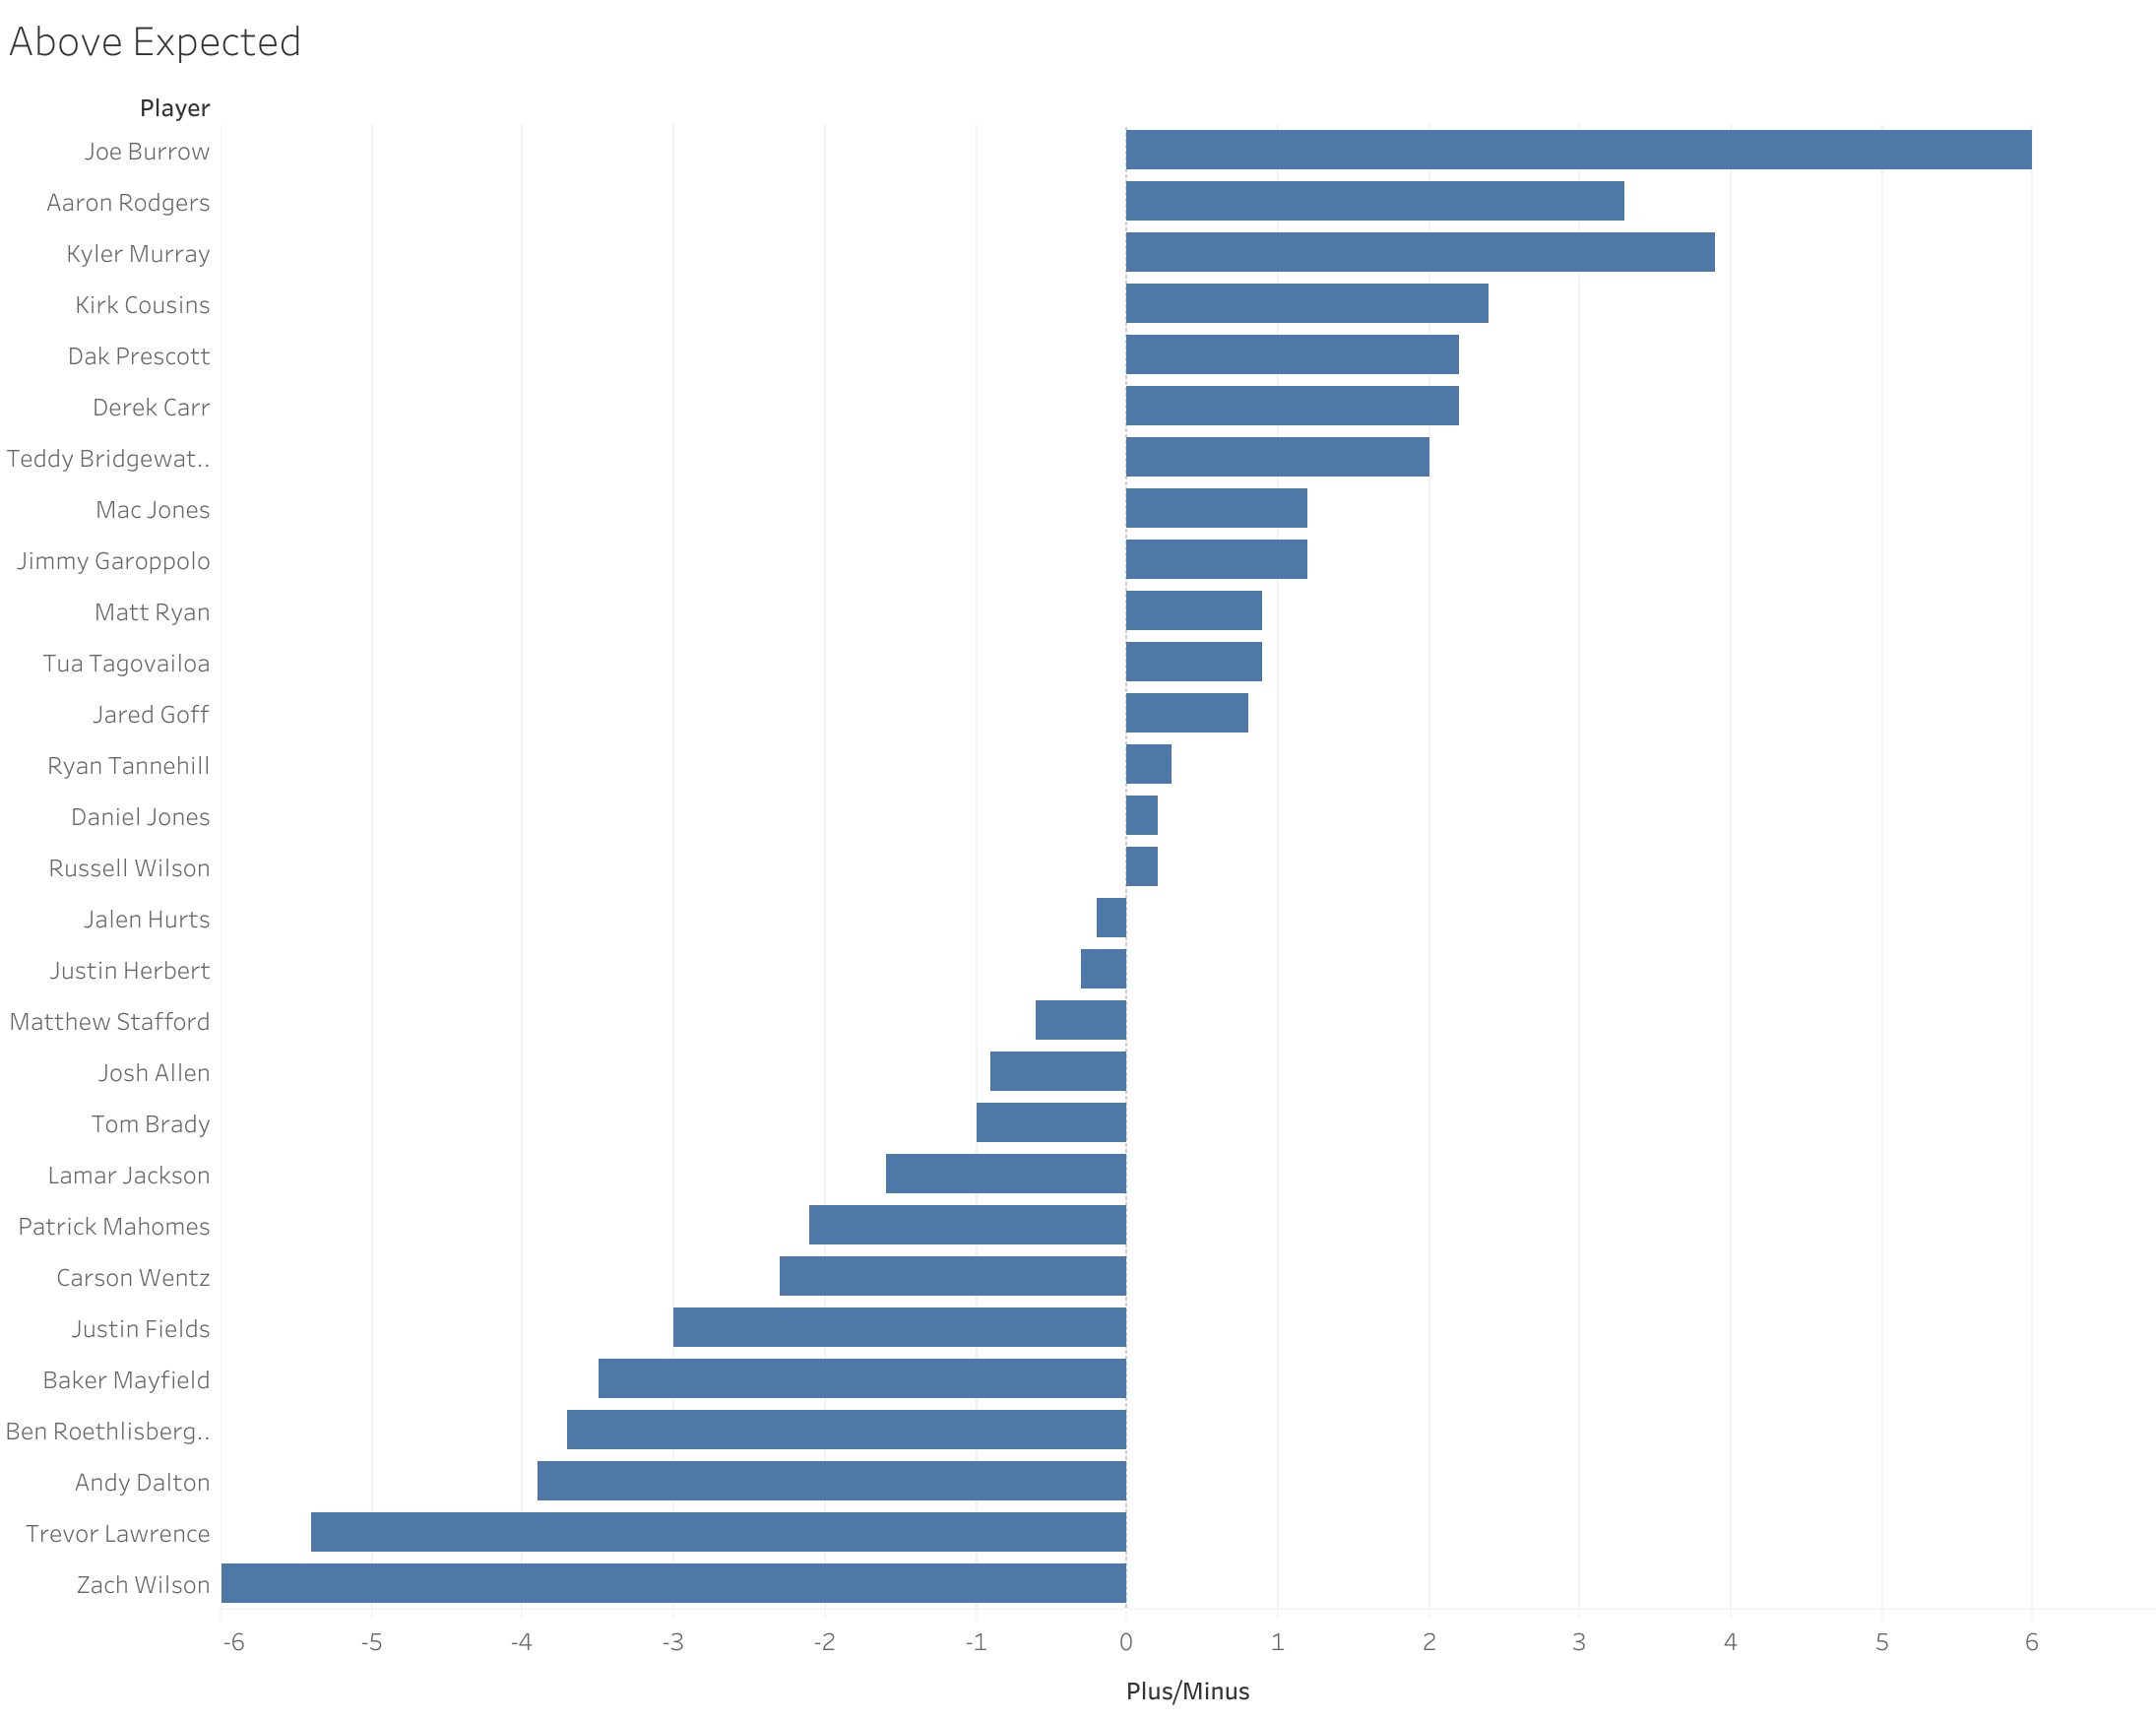
As you can see, Burrow ran away with this achievement, almost doubling the CPAE of Rodgers. Essentially, this tells us that relative to other quarterbacks in similar throwing conditions (receiver separation from the nearest defender, where the receiver is on the field, the separation the passer had at time of throw from the nearest pass rusher, and more), Burrow is most accurate.
Okay, one last point: Burrow did all of this while he was sacked a league-leading 50 times last season. Meanwhile, Rodgers only suffered 30 sacks. They had similar ‘Time to Throw’ numbers, with Burrow at 2.69 and Rodgers at 2.63; the Bengals offensive line just happened to be one of the worst in the NFL. Joe Burrow’s numbers are even more impressive taking into account the lack of protection he endured this season. Just another example of Burrow offering more value by doing more with less.
Ultimately, his dominant CPAE number, along with the second highest equipoise number ever recorded, should have catapulted Burrow into the front of the MVP discussion. After all, Burrow’s dominance in the new measures that we’ve discussed should equate to the highest value, in my opinion. The numbers that we’ve chosen to focus on isolate the effect of Joe Burrow by examining his exceptional ability to balance opposing factors at his position relative to other QBs. Elements of quarterback evaluation that we’ve covered, volume, efficiency, and equipoise, are encapsulated by this one player, and nobody seemed to take a good look.